Evaluation of Prediction Methods for Nominal Axial Resistance of Drilled Shafts in Cemented Soils
Kevin Stanton1 and Ramin Motamed2*
1Arup, San Francisco, USA
2Department of Civil & Environmental Engineering, University of Nevada Reno, USA
Submission: January 20, 2018; Published: March 29, 2018
*Corresponding author: Ramin Motamed, Department of Civil & Environmental Engineering, University of Nevada Reno, Virginia St, Reno, USA, Tel: (775] 784-6960; Email: motamed@unr.edu
How to cite this article: Kevin S, Ramin M. Evaluation of Prediction Methods for Nominal Axial Resistance of Drilled Shafts in Cemented Soils. Civil Eng Res J. 2018; 4(2): 555634. DOI: 10.19080/CERJ.2018.04.555634
Abstract
The axial behavior of four drilled foundations was predicted using two different methods utilizing the computer programs CGI-DFSAP and SHAFT. The t-z style analysis employed in CGI-DFSAP was evaluated to better understand the applicability of the program in various soil conditions. The load-movement responses computed by CGI-DFSAP were compared to findings from SHAFT and Osterberg Cell (O-Cell) load test data. In particular, the impact of modeling techniques for cemented soils was investigated by using three separate approaches in which cemented layers were modeled as dense sand, stiff clay, or weak rock formations.
These methods were selected based on common practice in Southern Nevada. Overall, by assuming rock-like behavior, the most accurate estimates of load-movement behavior were observed. Despite this, a negative correlation between prediction accuracy and the average thickness of cemented soil layers as well as the percentage of cemented material was observed.
Keywords: Drilled foundations; Axial resistance; Cemented soils
Introduction
Background
Improved predictions of axially loaded drilled foundation response could lead to a more efficient design of full scale load tests, thereby enabling the collection of more useful data. Currently, the design methodologies provided in Brown et al. [1] and the AASHTO LRFD Bridge Specification [2] enable reasonable estimates, as long as it is possible to classify each geomaterial encountered as one of those described within the manuals. The same is typically true for t-z style analyses such as those employed in software suites such as TZ-PILE [3], FB- Deep [4], or CGI-DFSAP [5]. However, for problems involving materials that cannot be accurately classified as sand, clay, c-$, etc.; measured axial drilled foundation response is often more difficult to predict. One of these challenging materials is carbonaceous cemented sandy soil, colloquially referred to as caliche in the Las Vegas Valley. Caliche is common in Las Vegas as well as in many other arid and semi-arid regions throughout the world including, but not limited to, central and western Australia, parts of southern and northern Africa, western Spain, the Thar Desert in India, eastern Saudi Arabia, and other parts of the United States such as Arizona, California, Colorado, Idaho, Montana, New Mexico, Utah, Washington, and Wyoming [6].
According to Stone et al. [7], the presence of a highly cemented caliche layer, at least as thick at the shaft diameter, can reduce the response (i.e. settlement) by more than 50%. As reported previously in [8,9], and Zafir and Vanderpool [10], the compressive strength of caliche has ranged from 19,150 to 38,300kPa; although caliche strength was highly variable in general [11]. Even if laboratory testing indicates the presence of high strength caliche, other factors such as the lateral extent, continuity, and thicknesses of these layers must be evaluated before the caliche layer can be considered viable for load bearing. Consequently, base resistance in caliche is typically neglected in practice. There is also no widely accepted method for considering the strength of caliche in nominal axial resistance predictions for drilled shaft foundations. Hence, the goal of the present study is to explore the accuracy of couple of existing methods for predicting load-movement behavior of drilled foundations in highly cemented material and provide some general recommendations.
Motamed et al. [12] used the Deep Foundation System Analysis Program [13] to predict the load-movement response of one drilled foundation that had been subjected to a full scale bi-directional axial load test. The prediction results were very close to the measured data for this test but the soil conditions did not include cemented material.
Therefore, this study aims to provide evidence about the impact of caliche on similar analyses to those conducted by Motamed et al. [12]. To accomplish this, a sensitivity analysis was carried out to investigate how the overall caliche percentage of the soil profile and the average thickness of caliche layers correlated with load-movement prediction accuracy. The methods employed for modeling caliche, described in more detail in the next section, were developed based on different design practices that are common in Las Vegas and are more thoroughly evaluated herein.
Approach
In this study, the two different t-z style analyses were carried out to make load-movement predictions for four drilled foundations subjected to bi-directional loading with an Osterberg load cell (O-Cell). For all cases, the test foundations were modeled, based on the information provided in the load test reports, as reinforced concrete shafts with free-head fixity, constant stiffness, and a uniaxial compressive strength of concrete assumed to be 27530kPa.
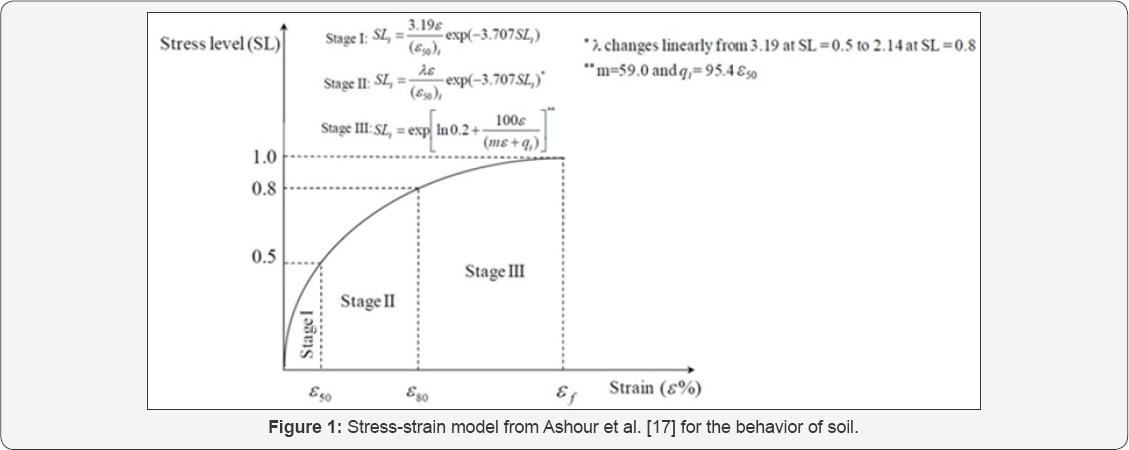
The first analysis type, hereafter referred to as M1, was implemented with the computer program CGI-DFSAP [5]. CGI- DFSAP employs a semi-empirical framework to enable the same t-z style analysis as its predecessor, DFSAP, but it allows for 15 soil layers as opposed to only 10. The program develops internally computed t-z and Q-z curves (i.e. for side and tip resistance, respectively) by employing the procedures described by Ashour and Helal [14] for cohesionless material and Ashour et al. [15] for cohesive and rock-like material. Both of these methodologies rely on the constitutive model to characterize soil behavior developed by Norris [16] and modified by Ashour et al. [17]. This is depicted in Figure 1.
The second analysis type, hereafter referred to as M2, is more representative of the standard of practice. M2 was implemented herein with the computer program SHAFT [18] which is based on methodologies presented in past FHWA guidelines for design and construction of drilled foundations [19,20].
Thus, the load-movement predictions from SHAFT were assumed to represent those of traditional design methods and provide a reference for the quality of the CGI-DFSAP predictions.
Each model developed herein was reproduced using three approaches to investigate the effects of modeling caliche as dense sand, stiff clay, or weak rock formations. The drilled shafts included in this study were chosen mainly for the load test data quality and because the descriptions provided within the boring logs and drilling rates suggested that all caliche layers were medium to highly cemented. As a result, it was assumed that the strength properties of caliche were the same for all of the tests that were analyzed. This assumption is also supported by information provided in Cibor [21] that relates drilling rates and caliche hardness classification to the degree of cementation.
Analysis
Shaft and soil properties
All of the full scale load test that were analyzed in this study were conducted by Load test, Inc. in the Las Vegas Valley. The shaft and soil properties were either taken directly from the corresponding Load test, Inc. reports or were obtained through additional material that was provided by Load test, Inc.
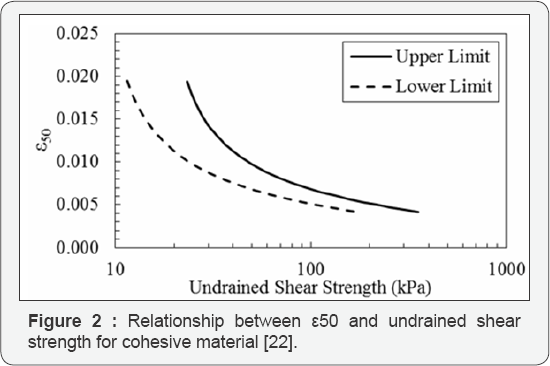
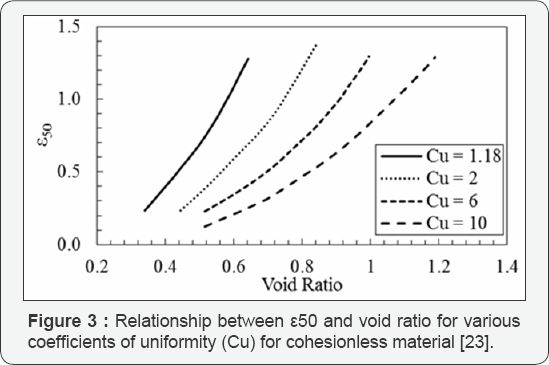
For all of the caliche models in M1 and M2, the unit weight was assumed to be 21.9kN/m3 based on data from Stone [9]. Also, the strain at 50% stress level, which was only required for Ml and known as s50, was determined internally by CGI-DFSAP This was accomplished in the program using empirically derived relationships from Evans and Duncan [22] for cohesive material and Norris [23] for cohesionless material. These relate s50 to the undrained shear strength of cohesive material (Figure 2) and to void ratio of cohesionless material (Figure 3), respectively.
Rock mass strength was required for modeling caliche as rock in CGI-DFSAP as well as in SHAFT and was estimated herein based on unconfined compression test data and Rock Quality Designation (RQD) values from Stone [9]. Assuming an average RQD value of 52%, the methods given in Hoek et al. [24] were employed to make the appropriate corrections to the rock mass strength to account for the effects of fracturing, discontinuities, etc. It should be noted that there was a considerable amount of uncertainty involved with these corrections since no laboratory data was available concerning the degree of cementation and fracturing of the caliche layers herein. Overall, laboratory tests on caliche were limited due to difficulties with retrieving quality samples and coring. The only useable evidence was from standard penetration blow counts, visual-manual descriptions and drilling rates from the boring logs.
Caliche was modeled as rock in SHAFT using the weak rock soil-type option. The interface between the caliche and the shaft concrete was assumed to be rough with closed joints and an interface friction angle equal to 2/3 of the internal angle of friction assumed for the caliche.
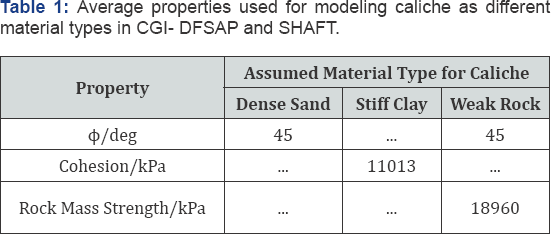
Since the rock mass strength had already been corrected as described above, the RQD was entered as 100% so that no further changes would be applied. Data from triaxial tests performed for Kleinfelder [25] was averaged to estimate the friction angle of caliche for the both the sand and rock models in CGI-DFSAP and SHAFT. A summary of the average properties used for modeling caliche is given in Table 1.

The percentage of a geomaterial along each test shaft is hereafter referred to as the material fraction. Hence, the caliche fraction was used to determine the relative impact of caliche on the predicted results. It follows that the best method for modeling caliche should show the smallest change in prediction accuracy as the caliche fraction increases. The mean caliche layer thickness, which ranges from 0.38m to 1.55m in this study, helps to reveal how both programs perform when modeling many thin caliche layers as opposed to a few thicker layers. It is possible that the appropriate method for modeling caliche is dependent on the thickness of an individual caliche layer; however, the scope of this study was to provide qualitative evidence regarding this question. The material fractions, mean caliche layer thickness, and other properties of the drilled shaft foundations are given in Table 2.
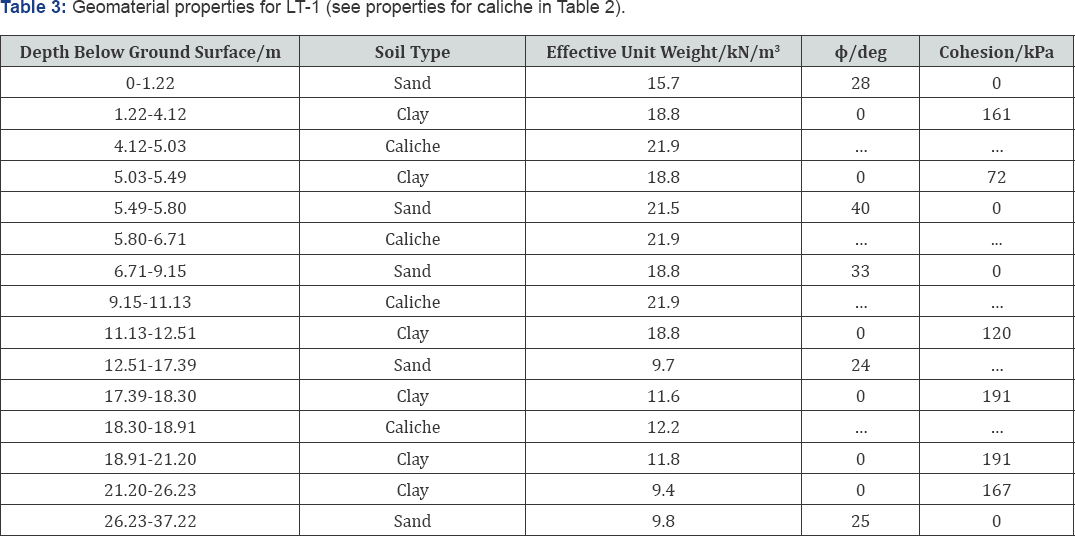
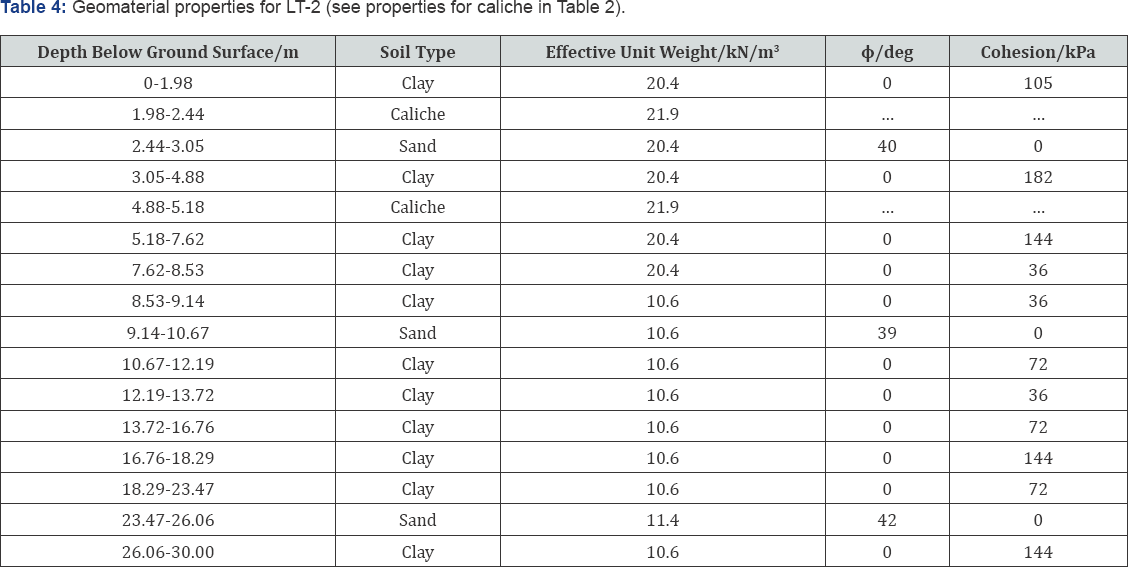
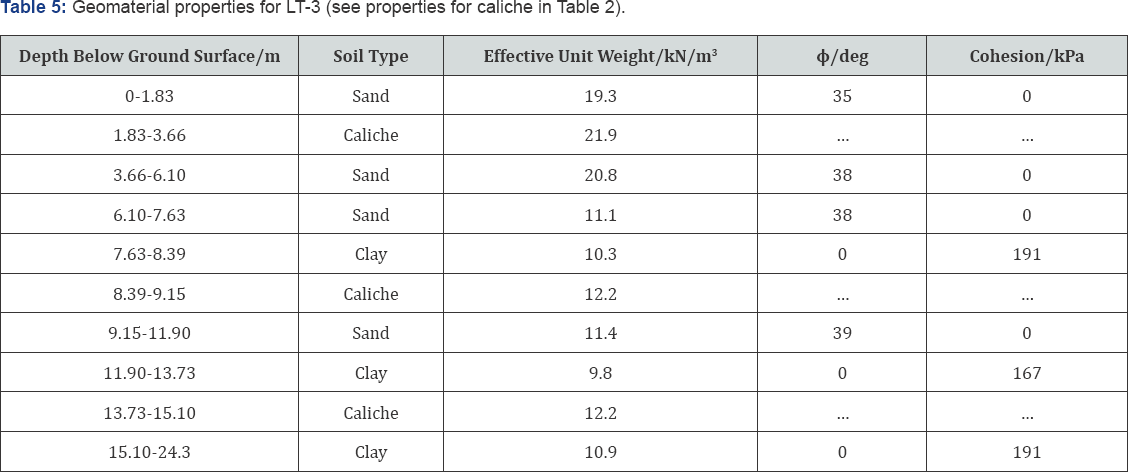
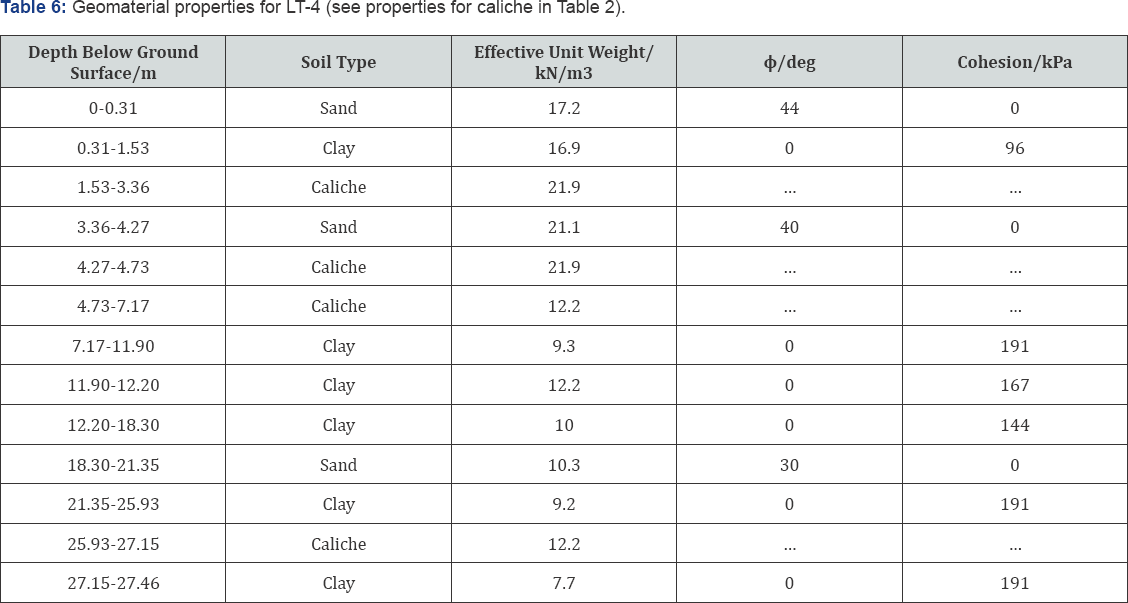
The geomaterial properties assumed for each test foundation are given in Tables 3 through 6. Note that unconfined compression and consolidated undrained triaxial test data was available for most of the non-caliche soil layers. Thus, the soil properties were based on this information as well as correlations to standard penetration test blow counts when needed.
Definition of failure
There were two potential failure modes considered herein from which the nominal axial resistance can be determined: geotechnical and structural. It should be noted that geotechnical failure is identified by one of two criteria: plunging or exceeding the strength limit state.
While none of the load tests displayed evidence of structural failure (e.g. concrete crushing above or below the O-Cell), geotechnical failure in the form of plunging appears to have occurred before the criteria for the strength failure state recommended in the AASHTO and FHWA design manuals was met for LT-2 and LT-3. Therefore, it was important to compare the measured and predicted values at the displacements for which movements occur without additional load. These values corresponded to about 1.91cm and 2.16cm for LT-2 and LT-3, respectively.
Each analysis was extended to show the predicted load- movement behavior up to and past the movement corresponding to geotechnical failure, which in the absence of plunging was defined as the displacement (5) equal to 5 percent of the shaft diameter (D), as is suggested by the AASHTO and FHWA design manuals. This geotechnical strength limit state was the assumed failure mode for LT-1 and LT-4, although LT-1 did meet the plunging criteria at this settlement level. To determine the measured axial capacities, the movement recorded above the O-Cell had to be extrapolated for all of the load tests except LT-4. This was accomplished by using hyperbolic curve fitting, as described in Chin [26]. Before the measured data was extrapolated, however, the procedure outlined in Load test [27] was used to adjust the movement above the bi-directional load cell for elastic compression.
Results
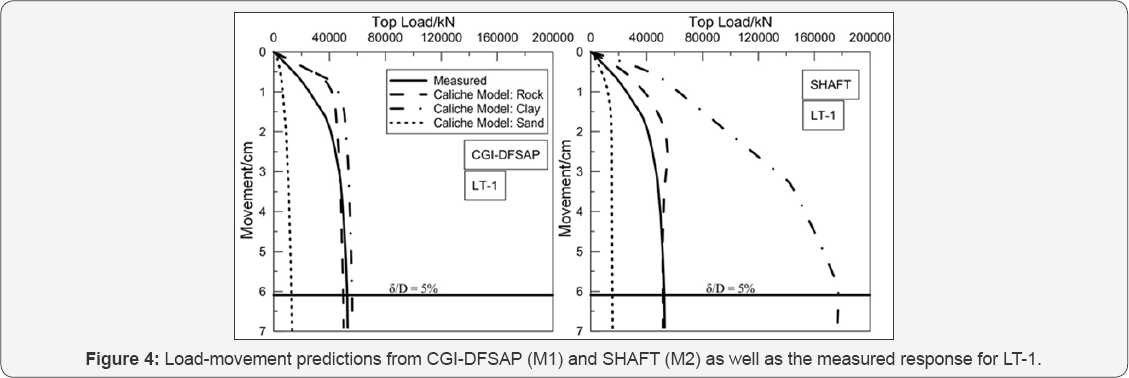
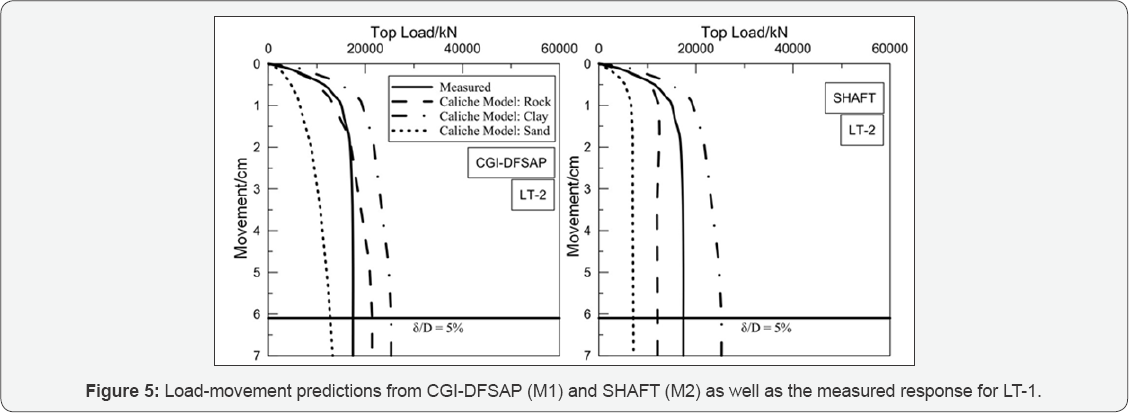
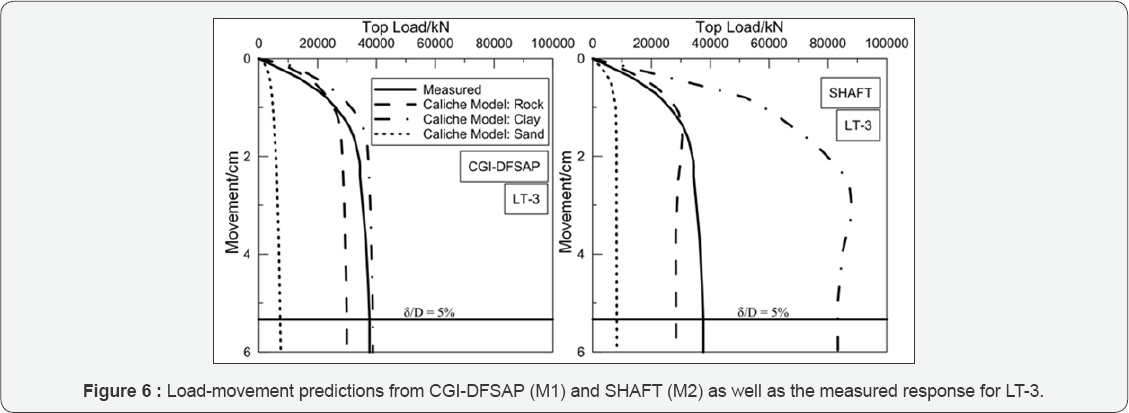
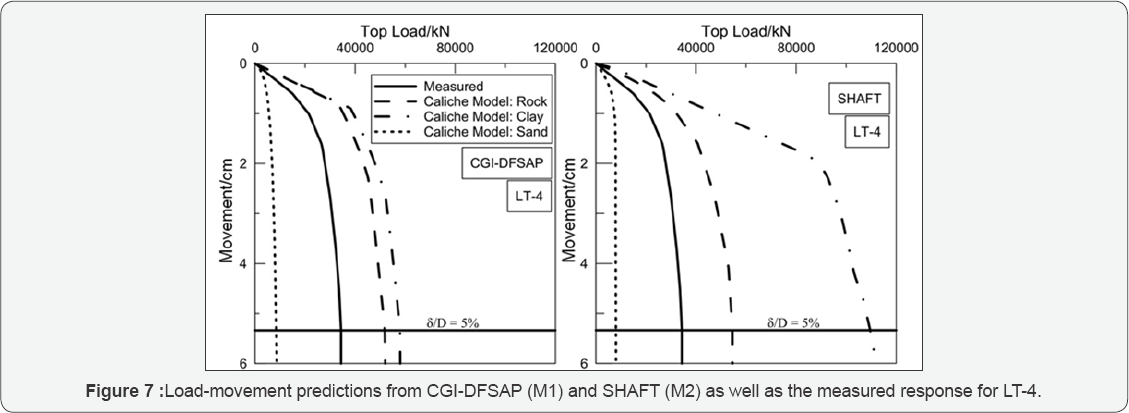
Figures 4 through 7 show the predicted results for each caliche material model as well as the measured response and movements corresponding to geotechnical failure. Table 7 provides the predicted and measured resistances at geotechnical failure for each test shaft.

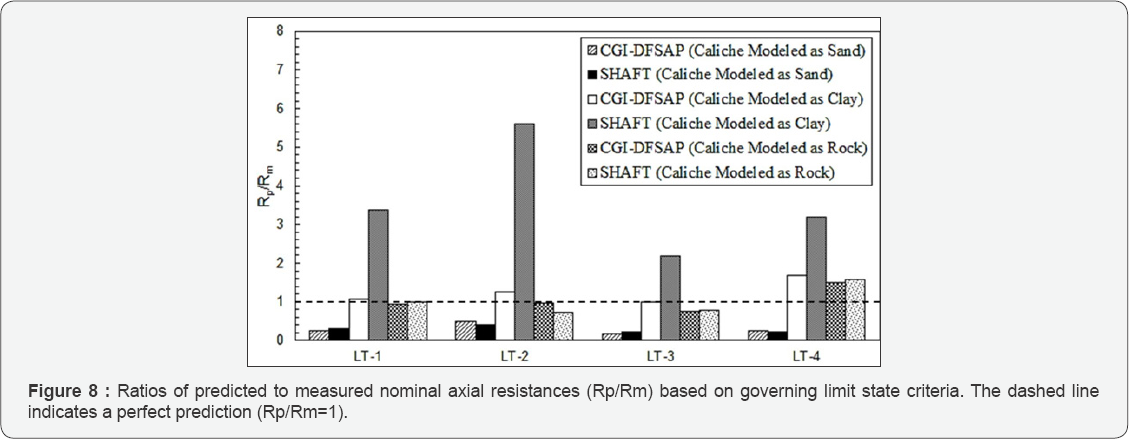
The data shown in Table 7 was for the strength limit state only. However, as previously mentioned, it was also necessary to evaluate the load-movement levels at which plunging failure was measured for LT-2 and LT-3. This information is given in Table 8. Note that plunging failure is defined as the point at which displacement continues without additional load. This was indicated by a vertical or negative slope as calculated with the sign convention from Figure 4 through 7. Therefore, for
LT-3, even though a larger load was eventually reached, the nominal axial resistance must be taken as the load associated with the onset of plunging failure. It should also be noted that geotechnical failure was evident before any extrapolation was applied for both LT-2 and LT-3. Hence, the ratios of measured and predicted resistances (Rp/Rm) based on the governing limit state criteria (i.e. strength limit for LT-1 and LT-4, plunging for LT-2 and LT-3) are presented in Figure 8.

Discussion
Inspection of Figures 4 through 8 reveals that modeling caliche as sand was not appropriate when using CGI-DFSAP or SHAFT. For both programs, assuming caliche behaves as dense sand gives a drastically underestimated response when compared to the measured resistance. It was also clear that, compared to the caliche clay model, the caliche rock model employed herein was associated with more accurate estimates of axial response. This was especially true for the SHAFT analyses, in which the clay models significantly overestimate the resistance in all cases.
While it was arguable that geotechnical failure was evident from the CGI-DFSAP predicted results for LT-3 (for the rock and clay assumptions), the same cannot be said for the LT-2 predictions. Consequently, a blind prediction of the LT-2 response would not have indicated plunging failure unless a more conservative definition of the strength limit state was employed to interpret the load-movement curve. Conversely, the predicted responses from SHAFT would suggest plunging failure would occur in all cases except LT-4. Thus, CGI- DFSAP appears somewhat capable of predicting the failure mode, though more data and additional analyses are needed to properly understand the reliability of these predictions. In addition, the results from SHAFT may only be useful for estimating the nominal resistance assuming plunging failure does not occur.
Overall, the weak rock model for caliche provides the most accurate results for both SHAFT and CGI-DFSAP. However, the clay assumption still gives reasonable estimates when using CGI-DFSAP; in fact, the LT-3 prediction was more accurate when the clay model was employed than when the rock model was employed. Thus, to gain more insight from the results, the root mean squared errors (RMSE) associated with the clay and rock models from CGI-DFSAP and the weak rock models from SHAFT were calculated by taking the square root of the sum of the squared residual errors between the predicted and measured resistances up to the settlements corresponding to the geotechnical strength limit state. This information is plotted against material fractions in Figures 9 through 11 and against mean caliche layer thickness in Figure 12.
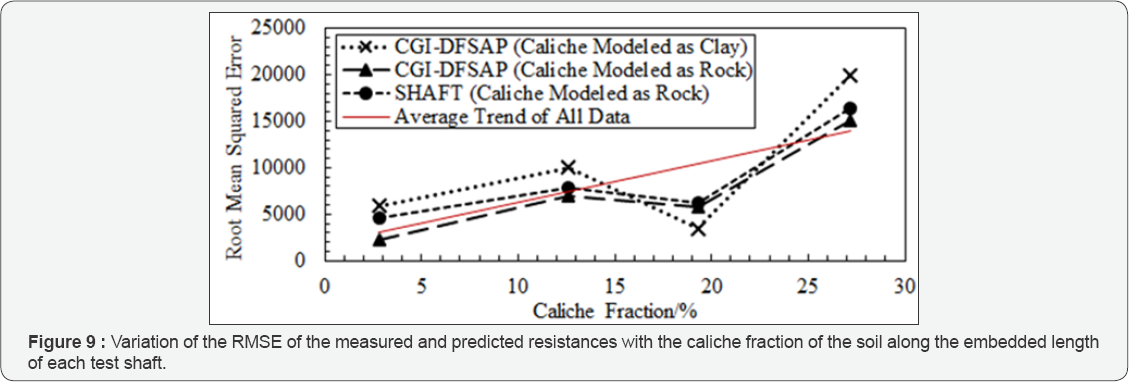
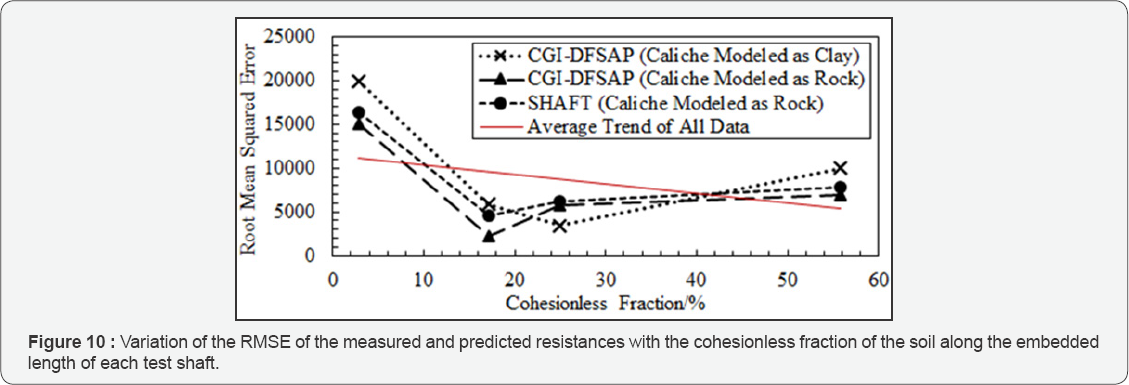
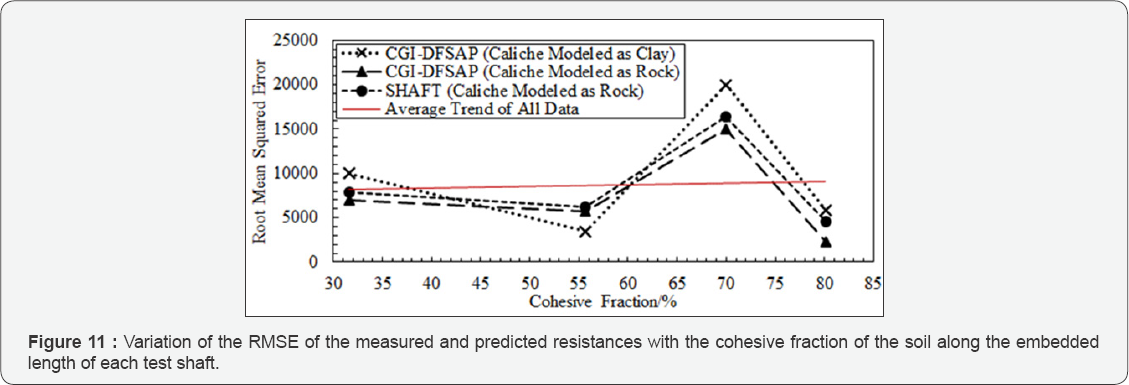
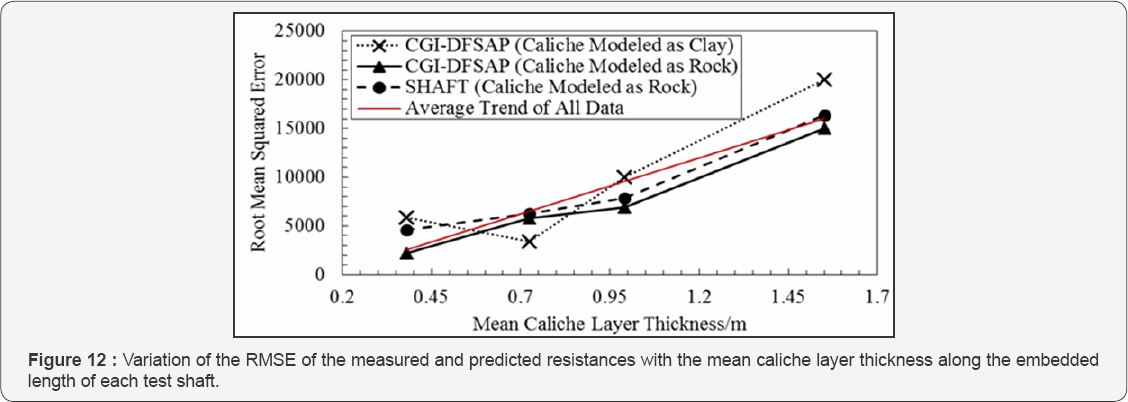
Figures 9 & 12 portray a generally negative correlation between the accuracy of the predictions and both the caliche fraction of the soil profile as well as the mean caliche layer thickness. Also, for the rock models, there is a more consistent negative correlation between mean caliche layer thickness and RMSE than caliche fraction. Comparing to the impact of other material types, Figures 10 & 11 reveal that, for this data set, the RMSE tends to decrease with increasing cohesionless fraction and does not appear to correlate with cohesive fraction. It is important to note that any observations regarding the dependency of prediction accuracy on caliche fraction must be made under the assumption that the caliche present in- situ was very similar for each of the test foundations considered herein. While an attempt was made to select data for which this assumption was valid, it should be kept in mind that it is possible that strength variations in the caliche formations have contributed to the variations in the RMSEs computed herein. Hence, more data is needed to determine if this was more impactful than the caliche fraction or mean caliche layer thickness.
Also evident by inspecting Figures 9 & 12 is that the caliche rock model implemented in CGI-DFSAP was the most accurate overall followed closely by the SHAFT rock model and the CGI- DFSAP clay model. Nevertheless, it was important to note that while a small RMSE does indicate a better fit to the measured data in general, it does not necessarily mean that a particular model was best suited for practical purposes. The most practical model should also have the greatest likelihood of predicting the correct failure mode, especially in cemented soil conditions for which plunging failure was common. Hence, the rock model for caliche employed in CGI-DFSAP appears to be the most practical approach investigated herein.
Conclusion
It has been shown that reasonable estimates of drilled foundation axial load-movement response can be obtained by modeling caliche as either weak rock or stiff clay in CGI- DFSAP with the parameters proposed in this study. Additionally, for the data herein, modeling caliche as weak rock in SHAFT also gives reasonable results that are generally more accurate than those from the CGI-DFSAP caliche clay models but slightly less than those from the CGI-DFSAP caliche rock models. Based on these analyses, the following recommendations and conclusions were made for modeling axially loaded drilled foundations in cemented soils:
• It was not appropriate to treat cemented soils as dense sand when using either CGI- DFSAP or SHAFT as the predicted responses were excessively conservative. Conversely, treating caliche as clay in SHAFT results in overestimated capacities and was also not recommended.
• In general, caliche was most accurately modeled as weak rock in CGI-DFSAP. The rock mass strength was determined by first estimating the unconfined compressive strength either from Stone [8] or from site-specific data. Then the methods from Hoek et al. [23] were used to adjust the strength based on an RQD which reflects the level of cementation and consistency of the caliche.
• Results should be interpreted with the knowledge that the onset of plunging failure might not be accurately predicted. This may not drastically affect the accuracy of the estimated nominal axial resistance but should be considered before assuming the failure mode indicated by the analysis.
• The program SHAFT (and the equivalent design procedures given in FHWA manuals) was prone to erroneously predicting geotechnical failure when analyzing cemented soils. Nevertheless, it was capable of estimating nominal axial resistance based on the geotechnical strength limit state with reasonable accuracy (particularly for LT-1) when the caliche was treated as weak rock and the strength was determined as previously discussed.
• The prediction accuracy decreased as the relative amount of caliche and mean caliche layer thickness increase for caliche fractions ranging from 3 percent to 27 percent and for mean layer thicknesses of 0.4m to 1.5m.?
While results from this study were promising, they also show that there was significant need for improvement in estimating axially loaded drilled foundation response in cemented soils. The conclusions drawn from these analyses shed light on how improvement might be achieved and also provide a basis for more focused research, which should add additional data to build on in the future.
Acknowledgment
The authors appreciate the support of Nevada Department of Transportation for providing the data necessary to conduct this study. Furthermore, we thank Sherif Elfass and Brandon Kluzniak for helpful comments.
References
- Brown D, Turner J, Castelli R (2010) Drilled Shafts: Construction Procedures and LRFD Design Methods. Technical Report FHWA NHI-10-016,Federal Highway Administration.
- AASHTO (2012) LRFD Bridge Design Specifications. American Association of State Highway and Transportation Officials, Washington DC.
- Ensoft (2014) Analysis of Load Versus Settlement for An Axially-Loaded Deep Foundation. Austin, TX: Ensoft, Inc.
- FB-Deep User's Manual (2010) Florida Bridge Software Institute (BSI), University of Florida, Gainesville, Fla.
- Computers and Geoengineering, Inc. (2011) Strain Wedge Model Computer Program for Piles and Large Diameter Shafts with LRFD Procedure. CGI-DFSAP User Manual.
- Reeves CC (1976) Jr. Caliche: Origin, Classification, Morphology and Uses. Lubbock, Texas: Estacado Books.
- Stone R, Karakouzian M, Afsharhasani R (2013) The Stiffening Effect of a Caliche Layer on Pile Foundations. In Proceedings of the 38th Annual Conference on Deep Foundations, pp. 513-518.
- Stone R, Luke B (2001) An overview of engineering with cemented soils in Las Vegas. In Proc. 36th Ann. Symp. Eng. Geol. Geotech. Eng, pp. 135-144.
- Stone R (2009) Analysis of a Caliche Stiffened Pile Foundation (Doctoral dissertation). University of Nevada, Las Vegas.
- Zafir Z, Vanderpool W (1998) Lateral response of large diameter drilled foundations: I- 15/US 95 load test program. In Proceedings of the 33rd Engineering Geology and Geotechnical Engineering Symposium, pp. 161-176.
- Werle J, Luke B (2007) Engineering with heavily cemented soils in Las Vegas, Nevada. Geo-Denver, p. 1-9.
- Motamed R, Stanton K, Nisimifar M, Kluzniak B (2015) A Methodology for Axially Loaded Drilled Shaft Performance Predictions Using DFSAPIn International Foundations Congress and Equipment Exposition (IF- CEE 2015), San Antonio, pp. 1791- 1805.
- Singh J, Ashour M, Norris G (2006) Laterally and axially loaded deep foundation systems-computer program DFSAP. Washington Department of Transportation Report.
- Ashour M, Helal A (2012) Response of Axially Loaded Piles in Sands with and without Seismically Induced Porewater Pressures. Int. J. of Geomechanics.
- Ashour M, Norris GM, Elfass S, Al-Hamdan AZ (2010) Mobilized side and tip resistances of piles in clay. Computers and Geotechnics 37(7): 858-866.
- Norris GM (1986) Theoretically Based BEF Laterally Loaded Pile Analysis. Third Int. Conf. on Numerical Methods in Offshore Piling, Nantes, France, pp. 361-386.
- Ashour M, Norris G, Pilling P (1998) Lateral Loading of a Pile in Layered Soil Using the Strain Wedge Model. J of Geotechnical and Geoenvi- ronmental Eng, ASCE 124(4): 303-315.
- Ensoft (2013) A program for the study of drilled foundations under axial loads. SHAFT v2012, Release Date: February 2013.
- Reese LC, MW O'Neill (1988) Drilled Shafts: Construction Procedures and Design Methods. Prepared for U. S. Department of Transportation, Federal Highway Administration, Office of Implementation McLean, Virginia, 1988.
- O'Neill MW, LC Reese (1999) Drilled Shafts: Construction Procedures and Design Methods, prepared for U. S. Department of Transportation, Federal Highway Administration, Office of Implementation, McLean, Virginia.
- Cibor JM (1983) Geotechnical Consideration of Las Vegas Valley. Special Publication of the American Society of Civil Engineers, Geological Environment and Soil Properties, Geotechnical Engineering Division, New York, NY, USA, pp. 351-373.
- Evans LT, Duncan GM (1982) Simplified analysis of laterally loaded piles. University of California Berkeley, Rept. No. UCB/GT/82-04.
- Norris GM (1977) The Drained Shear Strength of Uniform Quartz Sand as Related to Particle Size and Natural Variation in Shape and Surface Roughness. PhD thesis, University of California, Berkeley
- Hoek E, Carter TG, Diederichs MS (2013) Quantification of the geological strength index chart. In 47th US Rock Mechanics/Geomechanics Symposium. American Rock Mechanics Association.
- Kleinfelder (1996) US-95 and I-15 Load Testing Program, Las Vegas, Nevada. Report to Parsons Brinckerhoff, Las Vegas, Nevada, 89109.
- Chin FK (1970) Estimation of the Ultimate Load of Piles Not Carried to Failure. Proc Second Southeast Asian Conference on Soil Engineering, p. 81-90.
- Loadtest (2001) Construction of the equivalent top-loaded load-move- ment curve from the results of an O-Cell test, Loadtest Appendix to Reports.


