Design and Development of a Risk Identification and Analysis Tool (RIAT) for Australian Public-Private Partnership Infrastructure Projects
Michel Chaaya*
Department of Civil Engineering, University of Sydney, New South Wales
Submission: August 25, 2017; Published: October 26, 2017
*Corresponding author: Michel Chaaya, Adjunct Associate Professor School of Civil Engineering, Faculty of Engineering and IT, The University of Sydney, New South Wales, Tel: 0414690016; Fax: +6129351 3343; Email: michel.chaaya@sydney.edu.au
How to cite this article: Michel Chaaya.Design and Development of a Risk Identification and Analysis Tool (RIAT) for Australian Public-Private Partnership Infrastructure Projects. Civil Eng Res J. 2017; 2(5): 555596. DOI: 10.19080/CERJ.2017.02.555596
Introduction
The recent history of failed and inefficient Public-Private Partnership (PPP) infrastructure projects across Australia, due to their inappropriate risk identification and analysis, suggests the need to rethink a more appropriate and robust mechanism that not only quantifies the risk but also selects the optimal allocation of risk for all participants involved in a PPP project Australian Infrastructure Plan [1]. Past studies and research have identified the need to improve the quality of decision making in PPP projects. The variability of risk management processes and the lack of lucid and systematic practices towards risk analysis and allocation have often proved to be the downfall of PPP projects in Australia Fischer [2].
The research aims to design and develop a computerized Risk Identification and Analysis Tool using Visual Basics Application (VBA) that would assist stakeholders of PPP's in appropriately assessing and quantifying the risks inherent to such projects. The desired ultimate outcome is the enhancement of the capability and accuracy of the decision-making process in PPP projects.
Methodology
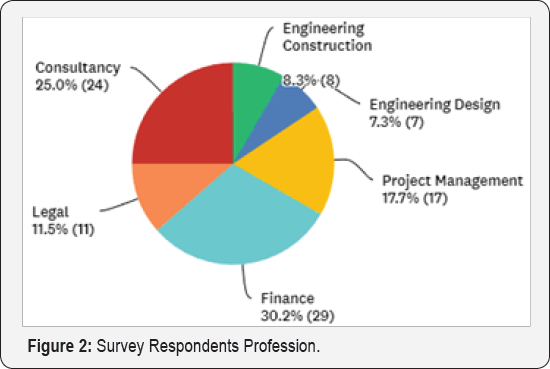
Figure 1 illustrates the methodology employed during this research investigation. Figure1 Summary of Research Methodology. The researchers have identified 33 risk factors (RFs) as being significant in influencing the success of a PPP projects. A list of over 2000 potential survey respondents was then constructed based on the core project stages of a PPP Project. The survey targeted industry professionals from both the public and private sector with relevant experience in PPPs ranging from: site engineers, project managers, legal and finance experts, consultants and public agents (Figure 2)-such as various state treasury departments and Federal Ministers. The Delphi survey asked for respondents to rank the initial 33 RFs separately for likelihood and severity on a 1-5Likert scale (with 1 = very low / no influence to 5 = almost certain / catastrophic influence).


Data Analysis
A suite of mathematical functions was then subsequently applied to the survey results. These included Factor Analysis and Fuzzy Synthetic Evaluation. Factor Analysis is a common yet powerful mathematical process whereby a relatively small number of factors can be determined to represent a larger sample size Norusis [3]. Such an analysis comes in many forms such as common factor analysis, image factoring, maximum likelihood method and Alfa factoring, however for this research investigation Principal Components Analysis (PCA) has been used due to its appropriateness for use in conjunction with Delphi Studies Yazdani-Chamzini 2014. Some critical assumptions that underpin such a method include a 1:5 ratio for variables to cases, some correlation between factors, a linear relationship between the variables, and the removal of outliers Lingard and Rowlinson[4] . This factor analysis further reduced the factors to key critical risk factor groups (CRFGs).
Fuzzy Set Theory (FST) is useful in situations where the inputs into a system are "fuzzy", ill-defined or subjective in nature, but the outputs must be clear and objective Chan et al.c.[5] . For this research investigation, the inherent nature of the data collected is subjective as it is based on the independent assessment of the industry professionals surveyed; hence Fuzzy Set Theory was deemed appropriate. Fuzzy Synthetic Evaluation (FSE) is commonly used in various risk management applications, as it is capable of synthetically evaluating 'an object relative to an objective in a fuzzy decision environment with multiple criteria' Zhao et al. [6]. The ability to deal with multiple qualities and components is a key advantage of FSE in assisting with complicated decision making and evaluations Mu et al. [7]. In this research FSE allows for the risk profile of PPP projects to be determined, utilising three levels of risk: critical risk factors, risk groups, and overall risk. This method will require the following components:
a) A family of factors, where m is the number of factors: E= {Ci, 2, C3 }
b) A set of alternatives:E={e1,2e3,_,en}
c) And an evaluation matrix: R= (rij) , where rijdenotes the degree to which ej satisfies the factor ci
VBA Model
The above process and resulting risk evaluation analysis tool was then computerised and automated through the utilisation of Excel with VBA. Excel was deemed an appropriate due to its widespread utilisation across the industry and ability to establish an easy to use interface. The end-user can input their subjective risk evaluations for a PPP project, and the expert intelligent system will produce a quantitative analysis of the overall risk level of the project and identify the key RFs that will need mitigating, as balanced against the expert opinion bank and end user expertise.
Results and Discussion
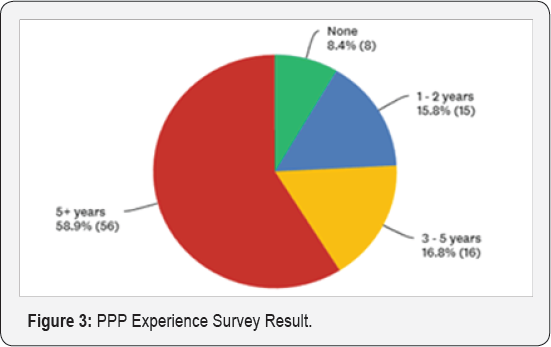
The online survey was closed after approximately 3 months with a total of 96 conforming responses gathered, with 76% of the respondents from the private sector and 79% with over 10 years' experience in the industry. Figure 3 below illustrates the breakdown of the respondents’ PPP experience. The bank of survey responses was analysed and any outliers removed. The subsequent mean scores of each RF in terms of its the probability of occurrence and severity were calculated using:

Where: f = frequency of each rating (1-5) for each RF, s = corresponding score given to each RF and N = total number of survey responses for a specific RF. The subsequent impact (Risk impact = -/(Probability x Severity) and thus ranking for each RF was determined using normalisation, with RF values greater than 0.5 being classified as critical risk factors (CRFs). 12 CRFs were identified with the top three observed as:
a. Delays in construction/completion
b. Construction cost overruns and
c.Demand forecasting risks
Factor analysis utilising factor extraction with Vari max rotation and Kaiser Normalisation was performed using Statistical Package for Social Sciences (SPSS). The data was tested for appropriateness using Kaiser-Meyer-Olkin (KMO) and supported with Bartlett's Test of Sphericity. As the KMO factor (0.814) was greater than 0.5 the factor analysis performed acceptable.
The four Critical Risk Factor Groups (CRFGs) observed were:
1) construction and operation risks
2) financing/consortium risks
3) political risks and
4) market risks
Each of the 12 CRFs fitted into one of the above CRGs and the subsequent weightings of each CRF was calculated on a weighted average of the mean scores. For each specific CRF the membership function was formed as a part of the FSE. For example, the demand forecasting RF for severity of occurrence was; 7% scored it very low, 19% as low, 35% as moderate, 32% as high and 7% as very high, as a result the membership function level 3 was expressed as (0.07, 0.19, 0.35, 0.32, 0.7). The same was generated for the probability of occurrence [(0.14, 0.27, 0.41, 0.14, 0.04)]. To obtain membership function level 2 the individual weighting of each CRF was multiplied and summed by its corresponding linguistic variable (very low (1)-very high(5) ). This process was repeated to form the overall risk index (level 1), but instead the CRFG weightings were used.

A VBA interface (Figure 4) was created to allow the end user to input their project specific details, such as: size, location and type of PPP and the extent to which they would like to weight their judgement and the survey data bank results. The output page illustrates the overall risk levels for each of the CRGS as well as the quantified risk level of the project on a 1-5 scale.
Conclusion
This research investigation presents a Fuzzy Synthetic Analysis approach to establishing a quantitative, hands-on and user-friendly tool based on subjective experts' beliefs sourced from leading Australian PPP professionals. In doing so this research allows industry practitioners, be it public or private, to better identify and assess the risk level of a PPP project based on objective results rather than subjective judgement. Future works in this area would focus on developing a system that updates the expert opinions continually as well as encompassing allocation of risk to the relevant party's as a means of further developing the tool.
References
- Australian Infrastructure Plan (2016) Better Decisions & Better Delivery.
- Fischer K, Leidel K, Riemann A, Wilhelm AH (2010) An integrated risk management system (IRMS) for PPP projects. Journal of Financial Management of Property and Construction 15(3): 260-282.
- Norusis M (2008) SPSS 16.0 Statistical Procedures Companion. (2nd edn), Prentice Hall Press, Upper Saddle River, NJ, USA.
- Lingard H, Rowlinson S (2006) Letter to the editor. Construction Management and Economics 24(1): 1107-1109.
- Chan D, Chan J, Ma T (2014) Developing a fuzzy risk assessment model for guaranteed maximum price and target cost contracts in South Australia Property. Management & Built Environment 32(11-12): 624646.
- Zhao Z, Hwang B, Gao Y (2016) A fuzzy synthetic evaluation approach for risk assessment: a case of Singapore's green projects. Journal of Cleaner Production 115(1): 203-213.
- Mu S, Cheng H, Chohr M, Peng W (2014) Assessing risk management capability of contractors in subway projects in mainland China. International Journal of Project Management 32(3): 452-460.


