Trends in Convective Available Potential Energy (Cape) and Extreme Precipitation Indices over the United States and Southern Canada for summer of 1979-2013
Mesgana Seyoum Gizaw and Thian yew Gan*
Department of Civil and Environmental Engineering, University of Alberta, Canada
Submission: May 26, 2017; Published: July 24, 2017
*Corresponding author: Thian Yew Gan, Department of Civil and Environmental Engineering, University of Alberta, Edmonton, Alberta, T6G 1H9, Canada, Email: tgan@ualberta.ca
How to cite this article: Mesgana S G, Thian Y G. Trends in Convective Available Potential Energy (Cape) and Extreme Precipitation Indices over the United States and Southern Canada for summer of 1979-2013. Civil Eng Res J. 2017; 1(2): 555556.DOI: 10.19080/CERJ.2017.01.555556
Abstract
Convective Available Potential Energy (CAPE) is a proxy for weather conditions amenable for the occurrence of extreme precipitation events. In this study trends in monthly CAPE data derived from the North American Land Data Assimilation System (NLDAS) database, and single or multiple event extreme precipitation indices, namely RX1day, RX5day and R20mm derived from the Global Historical Climatology Network daily precipitation data (GHCN-Daily) were analyzed for the summer of 1979-2013 over the United States (US) and southern Canada. Large statistically significant increasing trends in CAPE were detected in the low lying areas near the Gulf and Atlantic coasts. In addition, marginal increasing trends were detected for much of the northern Atlantic coast of the US, the Great Lakes region, parts of southern Ontario and Québec and some parts the Canadian prairies, while much of the US Great Plains and areas west of the Rockies had decreasing trends in CAPE.
Increasing trends in summer extreme precipitation indices were detected for much of eastern US and some parts of the prairie provinces of Canada which mostly complements increasing trends detected in summer CAPE data. The increasing trends in summer extreme precipitation events and CAPE over eastern US and parts of southern Canada is likely related to statistically significant (p<0.05) increasing trends in surface temperature and surface specific humidity in these regions. If the observed increasing trends in temperature, CAPE and specific humidity will continue in the future, as projected by global climate models of IPCC, eastern US and parts of the southern Canada such as southern Alberta could experience even more intensive extreme precipitation events over the 21st century.
Keywords: Convective available potential energy (CAPE); Extreme precipitation indices; Temperature; Specific humidity; Trends; US and South Canada
Introduction

where:
Tvp = virtual temperature of air parcel
Tve = virtual temperature of environment of the air parcel
LFC = Level of Free Convection
LNB = Level of Neutral Buoyancy
Rd = Gas constant of dry air
P = Pressure
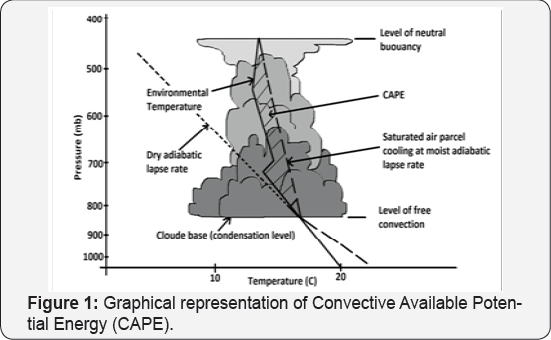
Convective Available Potential Energy (CAPE) is one of the widely used indicators on meteorological conditions favorable for the occurrence of intense precipitation events [1]. CAPE, (Equation 1, and Figure 1) the vertical integral of parcel buoyancy between the level of free convection and the level of neutral buoyancy Ye et al. [2], has been widely used to measure the onset of convection given higher values of CAPE (Joules/ kg) represent favorable conditions for the occurrence of severe convective storms and tornado events [3-6]. CAPE and its "opponent" counterpart, Convective Inhibition (CI) have been used to analyze convective precipitation variability, and trends or other changes in CAPE data of a region could be used to identify changes in convective systems of that region [7,8].
Assessment reports of the Intergovernmental Panel on Climate Change (IPCC) suggest that the global mean surface temperature has been increasing since instrumental records began in the late 19th century and the past three decades have been the warmest compared to all previous decades of instrumental records IPCC [9]. This increase in the global mean temperature has mainly been attributed to an increase in anthropogenic greenhouse gases, and it has likely contributed to more frequent and severe hydrologic extremes occurring across the world, as has been observed in recent decades IPCC [9]. For example, past studies have detected statistically significant increase in the frequency of heavy and very heavy precipitation events in different parts of the world [10-13]. Since CAPE is a proxy for weather conditions leading to occurrences of extreme events [3-6], recent changes in the global climate could also manifest itself with increasing or decreasing trends in CAPE in different parts of the world.
Recent studies analyzing CAPE data derived from radiosonde records have detected statistically significant trends in different parts of the world in late 20th and early 21st century. For instance, Meukaleuni et al. [14] detected significant trends in the 1979-2014 CAPE data for parts of West Africa with the largest increase in CAPE over the Congo basin between January and March.
Similarly, from detecting an increase in the monsoon rainfall and CAPE over the Indian region in 1984-2008, Murugavel et al. [7] suggested that a large increase in CAPE over this region could increase the frequency of its extreme rainfall events. Based on six hourly ERA-40 reanalysis data of the European Centre for Medium-Range Weather Forecast (ECMWF), Riemann-Campe et al. [8] found a high variability and a general increasing trend in CAPE over the Tropicsin 1958-2001. Their results agree with an earlier study of DeMott & Randall [15] who, from analyzing CAPE data derived from tropical radiosonde stations, found more stations with increasing trends in CAPE with the greatest numbers of positive trends occurring in the western Pacific and Caribbean.
Recent studies suggested an increase in CAPE correspond to rising Sea Surface Temperatures (SST) Seeley & Romps [1] and a strong dependency of CAPE on the specific humidity Riemann- Campe et al. [8]. Given global warming detected since the mid-Twentieth century will likely lead to an increase in SST and specific humidity globally, and given the positive relationships between CAPE, SST and specific humidity, this could lead to higher CAPE values, and therefore extreme weather events are expected to occur more frequently and in greater severity in the future.
The objective of this study is to identify trends in CAPE over United States and southern Canada for the summer of 19792013, and how they relate to trends in single or multiple extreme precipitation events, average surface temperature and surface specific humidity over this period.
Study Area, Data and Methodology
Study area
North America (NA) is the third largest continent in the world, with United States and Canada covering more than 80% of its landmass. Given it extends from about 10° north of the Equator to the North Pole, the climate of NA ranges from equatorial and humid subtropical in parts of Mexico and southeastern United States (US) to bitter cold, polar deserts in the Canadian Arctic. In addition, its climate is also influenced by elevations ranging from high mountain peaks of the Rockies to vast expanses of the Great Plains in central US and Canada and coastal lowlands of southern and eastern US (Figure 2).
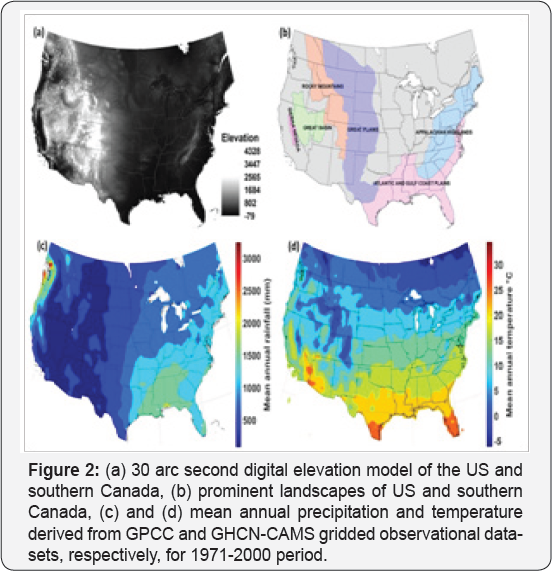
The focus of this study is on the US and southern Canada where the precipitation climatology varies widely. Western parts of Oregon and Washington states in the US and the British Columbia Province of Canada receive significant amount of orographic precipitation between May and October, while convective and cyclonic (frontal) precipitations dominate the May-September season in the Great Plains, the Atlantic and Gulf coast regions, respectively. With temperature dependent on latitude and elevation, southern parts of the US have warmer temperature compared to the Rockies and southern Canada. Overall, with some exceptions, US and southern Canada are progressively drier moving west from the Atlantic to the Pacific coast, and considerably warmer moving from southern Canada to southern US (Figure 2).
Data
The monthly CAPE data used in this study was taken from the North American Land Data Assimilation System-phase 2 (NLDAS-2), a collaborative project among several research institutes in the US including NCEP's (National Center for Environmental Prediction), Environmental Modeling Center (EMC), Princeton University and others Mitchell et al. [16] and Xia et al. [17]. NLDAS-2 assimilated a large quantity of observed and climate model reanalysis data. NLDAS-2 data, which has been validated against observations, is available at 0.125° spatial resolution over central North America. The CAPE data of NLDAS-2 was interpolated from NCEP's North America Regional Reanalysis (NARR) data.
NARR data was generated using, among others, lateral boundary conditions from NCEP-DOE R-2 reanalysis data Kanamitsu et al. [18], NCEP's operational version of Eta regional climate model Mesinger et al. [19] and some observed climate data assimilation systems. Because it assimilated observed data of climate stations, NARR can be considered as a pseudo-observation dataset. Similarly, monthly specific humidity data at various pressure levels is also derived from the NARR dataset.
In addition, observed daily precipitation and temperature data for stations across continental US and southern Canada were collected from the Global Historical Climatology Network (GHCN)-Daily, which is a processing system for the official archive of US daily data. GHCN also incorporated quality-assured data from over 80,000 stations over 180 countries [20]. Monthly and seasonal precipitation and temperature data over the US and southern Canada are computed from daily data of GHCN stations.
Research methodology
In this study, changes in CAPE and extreme precipitation over North America were mainly analyzed for the June-August season because summer is primarily a period of high CAPE values when frequent convective storms occur over much of US and southern Canada. The increasing or decreasing trends in CAPE, extreme precipitation, surface temperature and specific humidity were estimated using the nonparametric Theil-Sen Theil [21] and Sen [22] regression estimator, a robust technique to determine trends of time series [23,24]. Statistical significance of seasonal trends at p<0.05 were tested using the nonparametric Mann- Kendall test Mann [25] and Kendall [26], which is a robust trend analysis tool because it is capable of handling seasonality, missing values and non normality in a time series [27,28]. Only those GHCN stations with less than 0.5% of missing precipitation or temperature data for the summer of 1979-2013 were selected for trend analysis in the US region.
However, to have more stations for analysis, this selection criterion is slightly more lenient for southern Canada, and GHCN stations with less than 1% of the recorded data missing were selected for analysis. Changes in extreme precipitation at these GHCN stations were analyzed using extreme precipitation indices of the Expert Team on Climate Change Detection and Indices (ETCCDI) [9]. The indices selected represent single or multiple event extreme precipitation events, such as the RX1day (maximum precipitation depth in one-day), RX5day (maximum precipitation depth in five-day) and R20mm (number of days where daily precipitation exceeded 20mm). Each of these indices was computed for every summer and used to analyze for trends of extreme events for 1979-2013 over US and southern Canada. Besides changes in CAPE and extreme precipitation, trends in the average surface temperature at GHCN stations and surface specific humidity derived from NARR data were also computed and correlated with CAPE data.
Discussions of Results
Spatial and seasonal CAPE variability
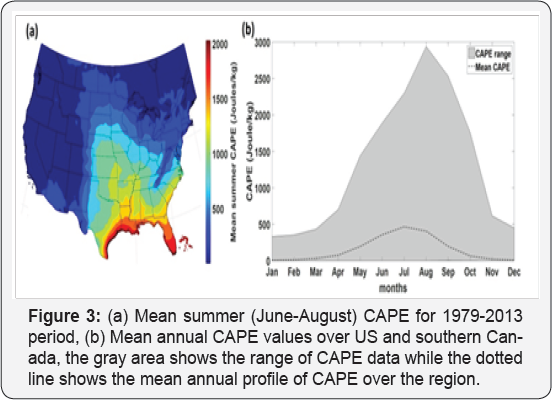
The mean of summer CAPE data for 1979-2013 shows significant spatial variability across US and southern Canada, such that along the Atlantic and Gulf coasts are maximum summer CAPE values, but CAPE gradually decreases as we move inland to the Great Plains (Figure 3). Compared to coastal areas, e.g. Florida, CAPE values are significantly lower in mountainous regions such as the Rockies and surrounding foothills where orographic precipitation dominates (Figure 2). Similarly, with its cooler climate, southern Canada has also lower CAPE compared to the warm, subtropical coastal plains of southeastern US. Annually, CAPE reaches the maximum in the warm summer of June-August which is also the period of intensive convective storms occurring over much of the US and southern Canada (Figure 3).
Trends in summer CAPE and extreme precipitation indices
For the summer of 1979-2013, large statistically significant increasing trends in CAPE were detected in low laying areas near Gulf and Atlantic coasts, particularly in southern Florida and southern Texas (Figure 4). However, significant decreasing trends were also detected for parts of northern Texas, Louisiana, Oklahoma and Arkansas. In addition, for much of the Great Plains of the US, there was a statistically significant decreasing trend in CAPE reaching up to 15 Joules/kg/year in southern parts of the Great Plains. Other than the Atlantic, Gulf coastal plains and the Great Plains, a minor decreasing trend in CAPE was also detected for almost all of central and western US and parts of southern Canada. In contrast, statistically significant increasing trends in CAPE were detected for much the north Atlantic coast of the US, the Great Lakes region and parts of southern Ontario and Québec. Similarly, moderate increasing trends in CAPE were also detected in some parts of southern Alberta, southern Saskatchewan and Manitoba of the Canadian Prairies.

Trends in extreme precipitation indices, namely, RX1day, RX5 day and R20mm for 1979-2013 are shown in Figure 5. The spatial distribution of increasing or decreasing trends of extreme precipitation indices detected for GHCN stations are similar to the spatial distribution of detected trends in CAPE data. Generally, increasing trends dominate the eastern Atlantic coast of the US for all extreme precipitation indices analyzed in this study.
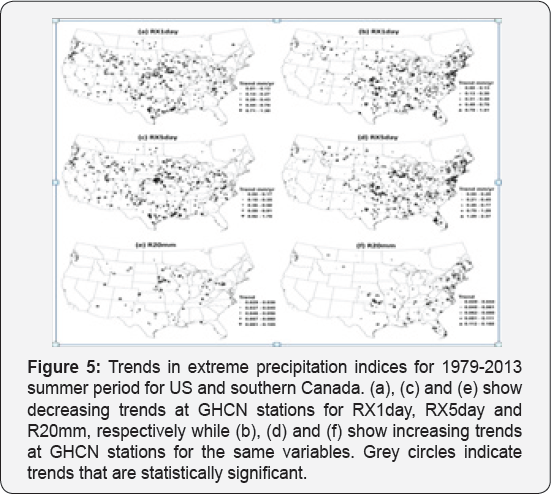
In addition, increasing trends in RX1day, RX5day and R20mm were also detected in southeastern Atlantic and Gulf coastal plains of the US, namely Florida, Georgia, Alabama, northern Texas etc., parts of the US mid-west and Great Lakes region and some areas in southern Alberta. In most of these areas, increasing trends were also detected in CAPE values (Figure 4). On the other hand, primarily decreasing trends in extreme precipitation indices were detected for the Great Plains, parts of southern Texas and the US mid-west and most parts of western US which are also in agreement with detected decreasing trends in CAPE of these regions. For the mountainous region of western US where summer CAPE values are small (Figure 2 & 3), either minor or no trends were detected in extreme precipitation indices over 1979-2013.
The detected trends in extreme precipitation in terms of R20mm for the summer 1979-2013 exhibit obvious spatial variability across the study areas. Increasing trends in the summer R20mm were detected for eastern US, particularly the Atlantic coast and Gulf of Mexico region. In addition, some parts of the Canadian prairies, such as southern Alberta, also show marginal increasing trends in R20mm. On the other hand, decreasing trends were limited to some parts of south and mid-west US, while much of western US, where convection plays little role in its summer precipitation climatology, hardly had trend detected for R20mm.
The spatial variations of trends in RX1day and RX5day are also very similar to that of R20mm. For areas east of the Great Plains where convective and cyclonic precipitation dominate the summer rainfall, increasing trends up to 14mm/decade for single storm events (RX1day) and up to 24mm/decade for multiple extreme storm events (RX5day) were detected. Similar to R20mm, most decreasing trends detected in RX1day and RX5day came from the Great Plains and central US whereas only marginal decreasing or increasing trends were detected for GHCN stations west of the Rockies where orographic precipitation dominates. On a whole, statistically significant trends were only detected for about 5.2% (RX1day), 6.7% (RX5day) and 2.7% (R20mm) of GHCN stations in US and southern Canada analyzed in this study.
In summary, results from the trend analysis of CAPE and extreme precipitation indices show that there have been increasing trends of CAPE and extreme precipitation detected, particularly in eastern US, and in Canadian prairies, such as parts of southern Alberta which had recently suffered some of the worst floods ever recorded. In contrast, areas within and around the Great Plains of US, and some parts of southern US were dominated by decreasing trends in CAPE and extreme precipitation indices.
Trends in summer temperature and surface specific humidity
Because the rate of depletion ofmoisture from the atmosphere by precipitation far exceeds its rate of replenishment by local surface evaporation and atmospheric moisture transported from elsewhere, the increased water-holding capacity of a warmer atmosphere will likely favor a general increase in the occurrence of extreme precipitation events [29]. Given some increasing trends in CAPE and extreme precipitation indices were detected over the summer of 1979-2013, trends in the average surface temperature and surface specific humidity which influence the evolution of convective precipitation have also been analyzed.
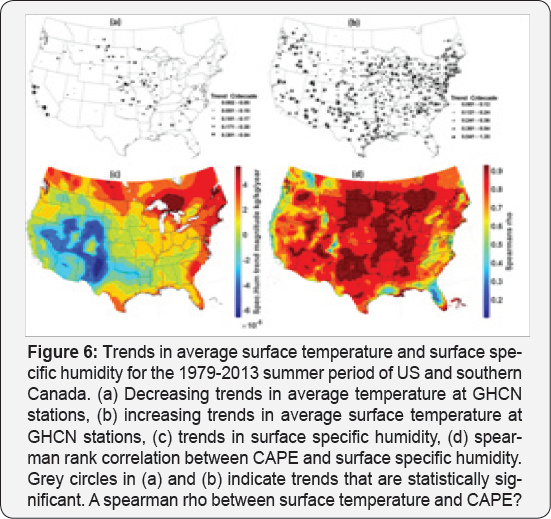
In almost all parts of the US and southern Canada, increasing average temperature trends ofup to 1.35°C/decade were detected in the summer, with about 35% of the detected increasing trends at the GHCN stations being statistically significant at p<0.05. However, decreasing trends were also detected for a few stations around the US Great Plains and the Pacific coast of California although only 5% of the detected decreasing trends were statistically significant (Figure 6). Similarly, increasing trends in the surface specific humidity were also detected for almost all parts of southern Canada and most parts of eastern US, but Rockies in southern US and the Great Basin region bordering Sierra Nevada mountain ranges of California (Figure 2) showed decreasing trends in surface specific humidity (Figure 6).
Based on the Clausius-Clapeyron relationship, changes in the saturation vapor pressure of the atmosphere with respect to changes in temperature can be represented as:
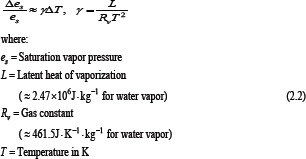
For  which is approximately 7% increase in vapor pressure per degree Kelvin rise in temperature,termed as the Clausius-Clapeyron (C-C) rate. Recent studies have used the C-C rate to analyze the impact of higher surface temperatures on the intensification of extreme precipitation events. For instance, Lenderink & van Meijgaard [30] analyzed 99 years of quality controlled 1-hour precipitation observations at De Bilt, the Netherlands, and found that hourly extreme rainfall intensities increase twice as fast with rising temperatures as expected from the C-C rate particularly during the summer when daily mean temperatures average more than 12 °C. On the other hand, daily extreme rainfall intensities were found to increase at a slower rate with temperature although there appears to be a steep increase in daily rainfall intensities for temperatures above 22 °C. For Germany, Berg et al. [31] found that the increase in higher convective precipitation intensities substantially exceeded the C-C rate for an increase in daily mean temperatures above 10 °C while strait form precipitation intensities generally increased at about the C-C rate.
Similarly, for parts of Eastern US, Utsumi et al. [32] found that extreme daily precipitation intensities increased with temperature up to a peak-point temperature threshold (Ta) and then decreased with further increase in Ta. From our analysis in Sections 5.2 and 5.3, detected increasing trends in temperature and specific humidity for most parts of eastern US and southern Canada complement the increasing trends in CAPE and extreme precipitation indices in these regions. Given that surface temperatures influence the latent heat release which drives the upward motion of moist air in convective precipitation [30] and also the strong dependency of CAPE on the surface specific humidity Riemann-Campe et al. [8] as demonstrated by very high spearman correlations between the two variables in almost all parts of the US and southern Canada (Figure 6), increasing trends in surface temperature and specific humidity could be responsible for much of the detected increasing trends in extreme precipitation indices and CAPE over eastern US and parts of southern Canada where summer precipitation is dominated by convective storms.
Although increasing trends in surface temperatures are also detected in the mountainous western US, such increasing trends in temperature were not mirrored with an increase in precipitation extremes since precipitation in this region is mainly orographic rather than convective. (How’s about precipitation in the US Great Plains where decreasing trends were also detected?) These results also suggest that for the remaining 21st century, the potential warming of several °C which contemporary GCMs (Global Climate Models) of IPCC have unanimously projected would likely mean that we will witness more extreme precipitation events occurring in eastern US and parts of southern Canada.
Summary and Conclusions
Analysis of the 1979-2013 North American summer CAPE data show increasing trends in areas along the Atlantic and Gulf coastal plains, eastern and northern Atlantic coast of the US, the Great Lakes region, parts of southern Ontario and Québec and also some parts of southern Alberta, Saskatchewan and Manitoba. Similarly, for the same period, increasing trends were also detected in single or multiple event extreme precipitation indices (RX1day, RX5day and R20mm) over much of eastern US and south-eastern Canada, parts of the Atlantic and Gulf coastal plains and some parts of southern Alberta and Saskatchewan. In contrast, most parts of the US Great Plains and areas west of the Rockies had decreasing trends in both CAPE and extreme precipitation indices.
The average temperature over most of the US and southern Canada show increasing trends in the summer with some stations having an increasing trend as high as 1.35 °C per decade. Similarly, increasing trends in the summer surface specific humidity were also found for almost all parts of southern Canada, eastern US and the Atlantic and Gulf coast regions. Given that an increase in surface temperature could lead to the intensification of extreme precipitation events [30-32], the observed increase in surface temperatures, together with the increase in surface specific humidity could be the major cause for increasing trends observed in extreme precipitation indices and CAPE over much of eastern US and some parts of southern Canada over the summer of 1979-2013.
Our results are similar to that of Ficklin et al. [33] who detected increasing trends in temperature over much of the US but decreasing trends in precipitation and specific humidity over large areas in southwestern US for the 1979-2013 period. Their results also show increasing trends in droughts in southwestern US, parts of Northern Texas and Louisiana and decreasing trends in droughts in areas such as northwestern US where an increase in CAPE and extreme precipitation indices were detected in this study. Our results also reflect (how?) the widely accepted paradigm that drying trends generally occur in arid regions while humid regions have a tendency towards wetting trends [34]. If observed trends in temperature and specific humidity continue through the 21st century, areas in eastern US and parts of southern Canada could experience even more intensive extreme precipitation events while arid regions in western US could experience more severe droughts in the future.
Acknowledgement
This project was partly funded by the Natural Science and Engineering Research Council of Canada, and the first author was also partly funded by the University of Alberta. Monthly CAPE data were derived from the North American Land Data Assimilation System (NLDAS) database, and daily precipitation data were taken from the Global Historical Climatology Network (GHCN) database.
References
- Seeley JT, Romps DM (2015) Why does tropical convective available potential energy (CAPE) increase with warming? Geophys Res Lett 42(10): 429-437.
- Ye B, Geno A, Lo K (1998) CAPE variation in the current climate and in a climate change. J of Climate 11: 1997-2015.
- Rasmussen EN, Blanchard DO (1998) A Baseline Climatology of Sounding-Derived Supercell and Tornado Forecast Parameters. AMS Weather and Forecasting 13: 1148-1164.
- Brooks HE, Lee JW, Craven JP (2003) The spatial distribution of severe thunderstorm and tornado environments from global reanalysis data. Atmos Res 67: 73-94.
- Doswell III CA, Evans JS (2003) Proximity sounding analysis for derechos and supercells: and assessment of similarities and differences. Atmos Res 67: 117-113.
- Brooks HE, Anderson AR, Riemann K, Ebbers I, lachs H (2007) Climatological aspects of convective parameters from the NCAR/NCEP reanalysis. Atmos Res 83: 294-305.
- Murugavel P, Pawar SD, Gopalakrishnan V (2012) Trends of Convective Available Potential Energy over the Indian region and its effect on rainfall. RMS Int J Climatol 32(9): 1362-1372.
- Riemann-Campe K, Fraedrich K, Lunkeit F (2009) Global climatology of Convective Available Potential Energy (CAPE) and Convective Inhibition (CIN) in ERA-40 reanalysis. Atmos Res 93(1-3): 534-545.
- IPCC (2013) Report Graphics Chapter 2. In: Hartmann DL, et al. (Eds.), Observations: Atmosphere and Surface, Cambridge University Press, Cambridge, USA.
- Alpert P, Ben-Gai T, Baharad A, Benjamini Y, Yekutieli D, et al. (2002) The paradoxical increase of Mediterranean extreme daily rainfall in spite of decrease in total values. J Geophys Res Letter 29(1): 31-34.
- Groisman P, Knight RW, Karl TR, Easterling DR, Sun B, et al. (2004) Contemporary Changes of the Hydrological Cycle over the Contiguous United States: Trends Derived from In Situ Observations. J Hydrometeorology 5: 64-85.
- Maheras P, Tolika K, Anagnostopoulou C, Vafiadis M, Patrikas I, et al. (2004) On the relationship between circulation types and changes in rainfall variability in Greece. Int J Climatology 24(13): 1695-1712.
- Tan X, Gan TY, Shao D (2017) Effects of persistence and large-scale climate anomalies on trends and change points in extreme precipitation of Canada. Journal of Hydrology, Elsevier Science, Netherlands.
- Meukaleuni C, Lenouo A, Monkam D (2016) Climatology of convective available potential energy (CAPE) in ERA-Interim reanalysis over West Africa. Atmos Sci Let 17(1): 65-70.
- DeMott CA, Randall DA (2004) Observed variations of tropical convective available potential energy. J Geophys Res 109(D2): 2004.
- Mitchell KE, Dag L, Paul RH, Eric FW, John CS, et al. (2004) The multiinstitution North American Land Data Assimilation System (NLDAS): Utilizing multiple GCIP products and partners in a continental distributed hydrological modeling system. J Geophys Res 109 (D7): 2007.
- Xia Y, Kenneth M, Michael EK, Juatin S, Brian C, et al. (2012) Continental- scale water and energy flux analysis and validation for the North American Land Data Assimilation System project phase 2 (NLDAS-2): 1. Intercomparison and application of model products. J Geophys Res 117(D3): doi:10.1029/2011JD016048.
- Kanamitsu M, Ebisuzaki W, Woollen J, Yang S, Hnilo JJ (2002) NCEP- DOE AMIP-II REANALYSIS (R-2). AMS, BAMS, USA, doi: 10.1175/ BAMS-83-11-1631.
- Mesinger F, Geoff D, Eugenia K, Kenneth M, Perry C, et al. (2006) North American Regional Reanalysis. AMS, BAMS, USA, pp. 340-360. DOI: 10.1175/BAMS-87-3-343.
- Menne MJ, Durre I, Vose RS, Gleason BE, Houston TG (2012) An overview of the Global Historical Climatology Network-Daily Database. J Atmoic Ocn Tech 29: 897-910.
- Theil H (1950) A rank-invariant method of linear and polynomial regression analysis. Indigationes Mathematicae 23: 345-381.
- Sen PK (1968) Estimate of the regression coefficient based on Kendall's tau. Journal of the American Statistical Association 63: 345-381.
- Wilcox RR (1998a) A Note on the Theil-Sen regression estimator when the regressor is random and the error term is heteroscedastic. Biometrical Journal 40 (3): 261-268.
- Wilcox RR (1998b) Simulations on the Theil-Sen regression estimator with right-censored data. Statistics & Probability Letters 39: 43-47.
- Mann HB (1945) Nonparametric tests against trend. Econometrica 13(3): 245-259.
- Kendall MG (1975) Rank Correlation Methods. Charles Griffin, London, England.
- Hirsch RM, Slack JR, Smith RA (1982) Techniques of trend analysis for monthly water quality data. Water Resour Res 18(1): 107-121.
- Gan TY, Barry RB, Gizaw M, Gobena A, Balaji R (2013) Changes in North American snow packs for 1979-2007 detected from the snow water equivalent data of SMMR and SSM/I passive microwave and related climatic factors. J Geophys Res Atm 118(14): 7682-7697.
- Trenberth KE (1999) Conceptual framework for changes of extremes of the hydrological cycle with climate change. Climatic Change 42(1): 327-339.
- Lenderink G, Meijgaard E (2008) Increase in hourly precipitation extremes beyond expectations from temperature changes. Nature Geoscience Lett 1: 511-514.
- Berg P, Moseley C, Haerter JO (2013) Strong increase in convective precipitation in response to higher temperatures. Nature Geoscience, Lett 6: 181-185.
- Utsumi N, Seto S, Kanae S, Maeda EE, Oki T (2011) Does higher surface temperature intensify extreme precipitation? Geophys Res Lett 38(16): doi:10.1029/2011GL048426.
- Ficklin DL, Maxwell JT, Letsinger SL, Gholizadeh H (2015) A climatic deconstruction of recent drought trends in the United States. Environ Res Lett 10: doi:10.1088/1748-9326/10/4/0440099.
- Feng H, Zhang M (2015) Global land moisture trends: drier in dry and wetter in wet over land. Scientific Reports 5: doi: 10.1038/srep18018.


