




 APBIJ Home




Abstract
Objective: To characterize the composition of a postbiotic preparation derived from fermented Polygonatum Sibiricum and Ganoderma Lucidum (PGF) and evaluate its intestinal anti-inflammatory and barrier effects.
Methods: Three substrates and their corresponding unfermented and fermented preparations were compared across 6 independently prepared batches each. Molecular-size fractionation, RAW264.7 and Caco-2 models, a Dextran Sulfate Sodium (DSS) study with 80 mice, and Nrf2 knockdown were used to evaluate fraction contributions and host responses.
Results: PGF contained 49.61±5.52 mg Glucose Equivalents (GE)/g reducing sugars and had an apparent weight-average molecular mass of 83.65±10.39 kDa, both lower than PG0; total carbohydrates did not differ significantly. PGF at 200 μg/mL reduced Lipopolysaccharide (LPS)-induced IL-6 by 42.2% and increased Caco-2 Transepithelial Electrical Resistance (TEER) by 23.61 percentage points. PGF at 400 mg/kg increased colon length relative to DSS by 1.31 cm (95% CI 0.73–1.88), with a difference retained in the cage-mean analysis. Both fractions retained anti-inflammatory responses, and reconstitution at the prespecified ratio retained both anti-inflammatory and barrier responses. Nrf2 knockdown attenuated the IL-6 reduction, with an interaction difference of 363.1 pg/mL (95% CI 83.2–643.0; Holm-adjusted P=0.041).
Conclusion: PGF activity was distributed across molecular-size fractions, with Nrf2 contributing to its cellular anti-inflammatory response. Composition, inflammatory modulation, and barrier improvement jointly characterized its intestinal protective effects.
Keywords: Polygonatum sibiricum; Ganoderma lucidum; postbiotics; intestinal inflammation; epithelial barrier; Nrf2
Introduction
Intestinal mucosal inflammation is sustained by immune activation, oxidative stress, and epithelial barrier injury. Increased epithelial permeability allows luminal stimuli to enter the mucosa continuously, while inflammatory mediators released by macrophages further damage tight junctions. Evaluating the intestinal effects of food-derived interventions therefore requires concurrent assessment of inflammation and barrier function; a single radical-scavenging measure cannot substitute for intestinal protection. In Dextran Sulfate Sodium (DSS) colitis studies, Polygonatum sibiricum polysaccharides have modulated mucosal inflammation and pyroptosis-related signaling, providing direct experimental grounds for investigating Polygonatum-derived preparations in the intestine [1]. The effects of steamed Polygonatum polysaccharides on the mucosal barrier and microbiota have also been examined experimentally [2].
Polygonatum rhizomes contain fructans, heteropolysaccharides, and saponins, and their soluble carbohydrate composition depends on plant species, thermal processing, and extraction conditions. Structural characterization and colitis studies of naturally acetylated fructooligosaccharides suggest that molecular mass and substitution patterns can both alter the biological activity of carbohydrate fractions [3]. Repeated steaming and drying change the polysaccharide and saponin composition of Polygonatum, identifying processing itself as a determinant of preparation composition [4]. Lactic acid bacterial fermentation can further alter the substrate through glycoside hydrolysis, organic acid production, and accumulation of microbial components. Studies of fermented Polygonatum kingianum polysaccharides support this processing approach, although their antioxidant and cardioprotective findings require evaluation in specific intestinal models [5].
Luo et al. [6] observed changes in Polygonatum saponins and associated metabolites in cultures containing Lactobacillus casei and Lactobacillus bulgaricus, indicating that microorganism–substrate interactions also involve noncarbohydrate constituents. Cao et al. [7] fermented Polygonatum with Lactiplantibacillus plantarum NX-1, detected changes in polysaccharides, saponins, and lipid-associated metabolites, and evaluated effects on lipid metabolism. Wang et al. [8] subsequently obtained a 5.4 kDa agavin-type fructan through Bacillus licheniformis fermentation and ultrafiltration and observed amelioration of colitis in DSS-treated mice [9]. Another fermented Polygonatum study reported reductions in Reactive Oxygen Species (ROS) and neutrophil migration in zebrafish models of skin oxidative injury and inflammation [10]. Together, these studies associate fermentation with altered functional phenotypes across different models. Here, macrophage inflammation and intestinal epithelial permeability were measured separately to establish endpoints directly relevant to intestinal function.
Ganoderma lucidum provides polysaccharides and triterpenoids, creating a combined substrate with a chemical composition distinct from that of Polygonatum alone. Studies of Ganoderma triterpenoids in colitis have linked inflammatory improvement to changes in intestinal metabolism [11]. The central questions are whether a common fermentation process produces a consistent composition from the combined materials, which fractions retain the major activities, and how much oxidative stress signaling contributes to the overall response. Comparisons limited to treated and inflammatory model groups cannot distinguish the effects of substrate combination, fermentation, and exposure dose.
Postbiotics are preparations of inanimate microorganisms and/or their components that confer a health benefit. Vinderola et al. [12] incorporated qualitative and quantitative characterization of the source microorganisms, functional components retained during manufacturing, and residual culturability into preparation characterization, emphasizing that quantification strategies should be product-specific [13]. Clarifications of the definition distinguish whole inactivated preparations from isolated metabolites, supporting the retention of microbial biomass in the present preparation [14]. Accordingly, L. plantarum was used to ferment a combined Polygonatum–Ganoderma substrate, with microbial biomass and soluble products retained after terminal heat treatment. Process-matched uninoculated controls and fermented single-substrate controls were included. Compositional changes, fraction contributions, cellular inflammatory responses, and barrier responses were examined sequentially, followed by DSS and Nrf2 knockdown experiments to assess the relationships between phenotypes and pathway responses.
Materials and Methods
Raw Materials and Preparation
The raw materials were dried rhizomes of Polygonatum sibiricum Redouté and dried fruiting bodies of Ganoderma lucidum (Curtis) P. Karst. Polygonatum (P), Ganoderma (G), and combined (PG) substrates were prepared at raw-material dry-mass ratios of 1∶0, 0∶1, and 1∶1, respectively. The materials were milled, passed through a 40-mesh sieve, and extracted with purified water at a solid-to-liquid ratio of 1∶20 in 2 extraction cycles at 90 °C for 60 min per cycle. The filtrates were pooled and freeze-dried to obtain aqueous extracts. Each substrate contained 20 g/L aqueous extract and 10 g/L glucose and was treated at 121 °C for 15 min before cooling for fermentation. Six raw-material batches were extracted independently. Substrate and processing conditions were allocated within each batch to create paired batches. The total amount of Polygonatum and Ganoderma aqueous extracts was held constant; the second material was not added on top of the same total extract mass in the combined group. Extraction volume, inoculation ratio, and drying procedures were identical across batches. Independent batches covered the complete extraction and fermentation workflow, and inoculated and uninoculated conditions were paired by raw-material batch.
The fermentation strain was Lactiplantibacillus plantarum ATCC 14917. After activation in MRS medium, cells were collected by centrifugation and washed 3 times with sterile saline to minimize medium carryover. Cultures were inoculated at 1×10⁷ CFU/mL and incubated statically at 37 °C for 24 h. Matched unfermented groups received an equal volume of sterile saline and were held at the same temperature for 24 h. All groups underwent terminal heat treatment at 80 °C for 30 min and were freeze-dried in their entirety without removing microbial biomass. Unfermented preparations were designated P0, G0, and PG0, and fermented preparations were designated PF, GF, and PGF. The freeze-dried powders were stored at −20 °C protected from light. All exposure concentrations were expressed on a powder dry-mass basis.
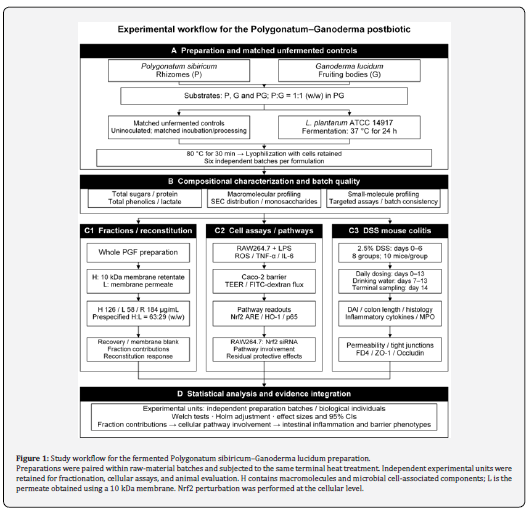
Viable counts before terminal heat treatment, culturable counts after treatment, pH, and dry-solids yield per unit culture volume were determined. After treatment, 1 mL of undiluted sample was plated on MRS agar and incubated for 72 h, giving a culturability detection limit of 1 CFU/mL. Constituent contents were reported both per gram of freeze-dried powder and per milliliter of the original culture; the latter was calculated using dry-solids yield to distinguish compositional enrichment from changes in total material amounts. The preparation and evaluation workflow is shown in (Figure 1).
Compositional Analysis and Molecular-Size Fractionation
Total carbohydrates were measured by the phenol–sulfuric acid method and expressed as Glucose Equivalents (GE). Reducing sugars were measured by the 3,5-dinitrosalicylic acid method, total phenolics by the Folin–Ciocalteu method as Gallic Acid Equivalents (GAE), and soluble protein by the BCA method. Sample-background wells at matched concentrations and solvent blanks were included for each batch to prevent color and turbidity from contributing to endpoint absorbance. Each assay used 3 technical replicate wells, whose mean represented one batch value. Total carbohydrates, reducing sugars, and total phenolics are method-specific equivalent measures and were not summed as component masses.
Apparent weight-average molecular mass was determined by size-exclusion chromatography with refractive index detection. An aqueous gel column was operated with 0.1 mol/L NaNO₃ as the mobile phase at 0.5 mL/min and 35 °C. Dextrans of different molecular masses were used to calibrate logM against retention time. Results were reported as dextran-calibrated apparent molecular mass. For monosaccharide composition, separate aliquots were hydrolyzed in 2 mol/L trifluoroacetic acid at 120 °C for 2 h. After acid removal, PMP precolumn derivatization and HPLC were used to determine the relative molar proportions of rhamnose, arabinose, xylose, mannose, glucose, galactose, galacturonic acid, and glucuronic acid. These proportions represent monosaccharides detectable after acid hydrolysis and were not used as a quantitative substitute for fructan content.
Lactic and succinic acids were quantified by ion-exclusion HPLC, whereas ferulic acid and ganoderic acid A were quantified by reversed-phase HPLC. The former used isocratic elution with 5 mmol/L H₂SO₄ and detection at 210 nm. The latter used a C18 column with 0.1% aqueous formic acid and acetonitrile; the acetonitrile proportion was increased from 15% to 85% over 30 min, with detection at 320 and 252 nm, respectively. Each analyte was calibrated externally against its corresponding reference standard. Calibration used 6 concentration levels, with spiked samples at 3 levels–low, medium, and high–and solvent blanks. Repeated injections were technical measurements and did not increase the independent sample size.
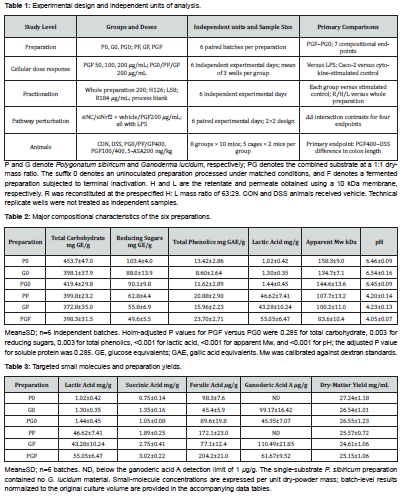
PGF was reconstituted at 20 mg/mL and separated using an ultrafiltration membrane with a 10 kDa molecular-weight cutoff into retentate H and permeate L. H was washed 3 times with a volume of purified water equal to the original solution volume; the washes were pooled with L, and both fractions were freeze-dried separately. H contained macromolecular and microbial biomass-associated components, whereas L was enriched in membrane-permeable small molecules. Membrane cutoff was not treated as chemical purity. The reconstituted fraction R was prepared at the prespecified H∶L mass ratio of 63∶29. A process blank was prepared by applying the same membrane procedure to purified water without PGF. The whole preparation was tested at 200 μg/mL, and H, L, and R were fixed at 126, 58, and 184 μg/mL, respectively. Recovery was determined independently; reconstitution doses followed the prespecified mass ratio.
Cellular Anti-Inflammatory Activity and Epithelial Barrier Assessment
RAW264.7 cells were maintained in DMEM containing 10% fetal bovine serum at 37 °C and 5% CO₂. Cells were pretreated with PGF at 50, 100, or 200 μg/mL for 2 h, followed by coincubation with lipopolysaccharide (LPS; 100 ng/mL) for 24 h. PF, GF, and PG0 were compared at 200 μg/mL. Fractionation experiments used H, L, and R at the prespecified fixed concentrations described above. Unstimulated and LPS model controls received matched volumes of vehicle. After sample addition, medium pH was adjusted to 7.2–7.4 and osmolality was maintained at 280–320 mOsm/kg to avoid direct effects of acidity on cells.
Cell viability was assessed using a metabolic viability assay, with subtraction of sample backgrounds measured in cell-free wells. Supernatant IL-6 and TNF-α were measured by ELISA. Nitrite was measured by the Griess method and reported as an NO-related endpoint. Cellular reactive oxygen species were assessed by DCFH-DA fluorescence, normalized to cell number, and expressed relative to the control. Each treatment used 3 wells per experiment, and their mean constituted one independent experimental-day value. Culture and treatment were performed on 6 different dates, yielding a statistical sample size of 6; technical replicate wells were not analyzed as independent observations.
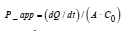
Caco-2 cells were seeded into Transwell inserts with 0.4 μm pores and cultured for 21 d. Monolayers were included once Transepithelial Electrical Resistance (TEER) exceeded 300 Ω·cm² and remained stable for 3 consecutive days. Preparations were applied apically for 2 h before basolateral stimulation with TNF-α and IL-1β at 10 ng/mL each for 24 h. Resistance was corrected for the blank membrane and multiplied by membrane area, then expressed relative to each insert's prestimulation value of 100%. A 4 kDa FITC-Dextran Tracer (FD4) was added apically at a final concentration of 1 mg/mL, and its cumulative basolateral appearance over 60 min was measured to calculate the apparent permeability coefficient. Here, Q is the transported amount, t is time, A is membrane area, and C0 is the initial apical concentration. A separate batch of monolayers was prepared on each experimental day, and the mean of 3 inserts per treatment was used.
Nrf2 Pathway Intervention
RAW264.7 cells were transfected with a pool of siRNAs targeting mouse Nfe2l2 at a final concentration of 25 nmol/L; the negative control received nontargeting siRNA at the same concentration. At 48 h after transfection, a 2×2 design was established under LPS stimulation: , , , and , with PGF at 200 μg/mL. All four conditions were included on each experimental day to provide within-day pairing. Knockdown was assessed from the relative signal of total Nrf2 protein.
Nrf2 in nuclear extracts was assessed using an ARE-binding activity assay, normalized to nuclear protein concentration. HO-1 was quantified by a protein immunoassay, and NF-κB signaling was assessed as the ratio of Ser536-phosphorylated p65 to total p65. IL-6 was measured concurrently. In the standard concentration experiment, nuclear Nrf2, HO-1, and phosphorylated p65 were normalized against an independent, fixed unstimulated-cell calibrator. The knockdown experiment retained the same independent calibrator scale, with the unstimulated-cell calibrator set to 1. To evaluate pathway involvement, the within-day PGF−vehicle contrast within each transfection background was denoted δ, and the prespecified interaction contrast ΔΔ was calculated between the siNrf2 and siNC backgrounds. For IL-6 and phosphorylated p65, a positive ΔΔ indicated attenuation of the PGF-associated reduction after knockdown. Interaction differences and their 95% confidence intervals were reported.

DSS Colitis Model and Outcome Assessment
The study design comprised 80 male C57BL/6J mice aged 8 weeks. After 7 d of acclimation, mice were randomized within baseline body-weight strata into 8 groups of 10 mice, housed in 5 cages per group with 2 mice per cage. The groups were normal control (CON), DSS model, PG0 at 400 mg/kg, PF at 400 mg/kg, GF at 400 mg/kg, PGF at 100 mg/kg, PGF at 400 mg/kg, and 5-aminosalicylic acid (5-ASA) at 200 mg/kg. All groups except CON received 2.5% DSS in drinking water ad libitum on days 0–6, followed by ordinary drinking water on days 7–13. Preparations were administered daily by oral gavage from day 0 for 14 d at 10 mL/kg. CON and DSS groups received an equal volume of water. This schedule assessed protection from an intervention initiated during model induction. DSS exposure and recovery were recorded separately, with drinking-water concentration, sampling site, and observation times standardized according to established model procedures [15]. Experimental units, randomization, and blinding were specified using the ARRIVE 2.0 reporting elements [16].
Body weight, stool consistency, and fecal blood were recorded daily. The Disease Activity Index (DAI) was the sum of three 0–4 subscores for weight loss, stool consistency, and fecal blood, giving a total range of 0–12. Weight losses of <1%, 1%–5%, >5%–10%, >10%–15%, and >15% received scores of 0–4, respectively. Normal, slightly soft, markedly soft, semiliquid, and liquid stools received scores of 0–4. Negative, weakly positive occult blood, strongly positive occult blood, visible blood streaks, and gross bleeding received scores of 0–4. On day 14, colon length was measured from the anal to the cecal end, and a fixed distal colon segment was collected for histological scoring.
Histology was scored for inflammatory infiltration, crypt destruction, and epithelial injury, each on a 0–4 scale, for a total of 0–12. Inflammatory infiltration ranged from absent to transmural; crypt destruction ranged from intact architecture to widespread loss; and epithelial injury ranged from intact epithelium to extensive erosion and ulceration. Coded sections were assessed independently by two scorers. Disagreements exceeding 1 point were reviewed jointly, and the final score was the integer value agreed after review. Colon length was the primary endpoint; DAI area under the time curve, histological score, and permeability were secondary endpoints. Cage identifiers were retained to represent clustering by housing environment. Sample size was based on colon length, using a between-group difference of 1.0 cm, a within-group standard deviation of 0.7 cm, a two-sided α=0.05, and 80% power. The normal approximation yielded approximately 8 mice per group; 10 per group were used. Confidence intervals were reported for the primary effect, and statistical significance was not used as a criterion for including or excluding animals.
Before terminal measurements, mice were fasted for 4 h and gavaged with FD4 at 600 mg/kg. Serum fluorescence was measured 4 h later, and concentrations were calculated from a calibration curve. Colon tissue was homogenized in a volume of precooled buffer equivalent to 9 times its mass to measure IL-6, TNF-α, and Myeloperoxidase (MPO). Cytokines were normalized to total protein and MPO to tissue wet mass. ZO-1 and Occludin were quantified by protein immunoassays and calibrated against an independent, fixed reference pool of normal colon tissue. Treatment codes and endpoint-assay codes were kept separate. Body-weight records, dissection measurements, and scores were completed before group identities were merged with the data.
Statistical Analysis
Groups, independent experimental units, and prespecified comparisons are summarized in (Table 1). Continuous variables are presented as mean±standard deviation, and trajectory plots show means with 95% confidence intervals. Histological scores are also summarized by medians and quartiles. Chemical analyses used independent preparation batches as the unit of analysis. PGF and PG0 were compared by paired t-tests, with Holm correction across the relevant compositional endpoints. Cell analyses used independent experimental days as the unit, with paired tests applied to within-day treatment differences. Prespecified comparisons within each endpoint formed a multiple-testing family. The Nrf2 intervention was assessed through within-day interaction contrasts, with Holm correction across the four interaction endpoints: IL-6, Nrf2-binding activity, HO-1, and phosphorylated p65.
The primary animal comparison was the difference in colon length between PGF at 400 mg/kg and DSS, assessed using a two-sided Welch t-test. Comparisons of the six treatment groups against DSS were Holm-adjusted within each endpoint. Histological scores were analyzed using two-sided Mann–Whitney tests with the same correction. Body-weight and DAI trajectories described the time course; DAI area under the curve was calculated by the trapezoidal rule, without separate significance tests at each day. The primary analysis was repeated using the mean of the two mice in each cage as a clustering sensitivity analysis. A cage-level bootstrap was also used to obtain an interval for the primary between-group difference. In the text, tables, and figures, P values are reported to three decimal places, with values below 0.001 shown as P<0.001. Individual raw and adjusted values are retained in the statistical results tables. All tests used a two-sided α=0.05.
Results
Fermentation Alters Carbohydrate Size and Small-Molecule Composition
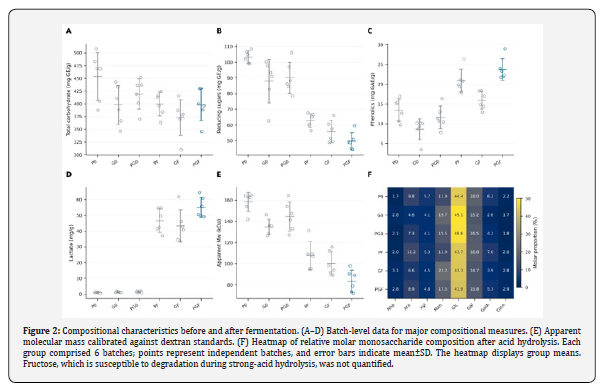
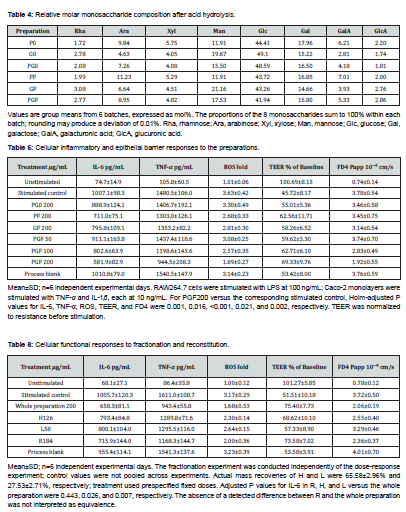
The final pH of PGF was 4.05±0.07, compared with 6.45±0.09 for PG0. No culturable microorganisms were detected in any preparation after terminal heat treatment. Dry-solids yields were 25.15±1.06 and 26.55±1.23 mg/mL, respectively. Reducing sugars decreased from 90.1±9.8 mg GE/g in PG0 to 49.6±5.5 mg GE/g in PGF, while apparent weight-average molecular mass decreased from 144.6±13.6 to 83.6±10.4 kDa; the corresponding Holm-adjusted P values were 0.003 and <0.001. Total carbohydrate contents were 419.4±29.8 and 398.3±31.5 mg GE/g in PG0 and PGF, respectively, without a significant difference (adjusted P=0.285). Thus, the principal changes involved reducing sugars and molecular size rather than a general reduction in total carbohydrates.
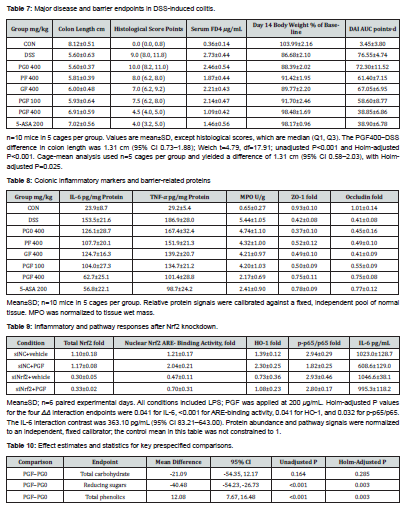
Total phenolics were 23.70±2.71 mg GAE/g in PGF and 11.62±2.89 mg GAE/g in PG0 (adjusted P=0.003). Lactic acid was 55.05±6.47 mg/g in PGF, compared with 1.44±0.45 mg/g in PG0 (adjusted P<0.001). Soluble protein changed little (adjusted P=0.285). Figure 2 and (Table 2) compare the compositions of the six preparations; targeted small molecules and monosaccharide composition are presented in (Table 3) and (Table 4). Normalization to the original culture volume preserved the directions of increased lactic acid and decreased reducing sugars.
PGF Reduces Macrophage Inflammatory Responses and Improves Epithelial Permeability
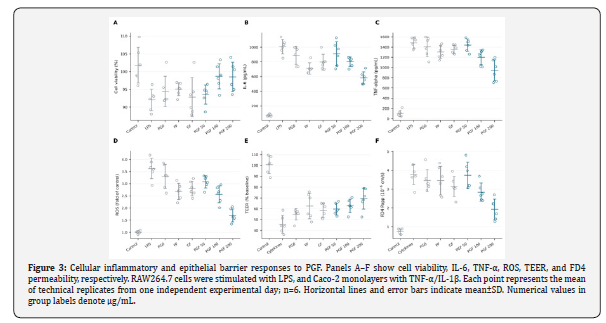
IL-6 and TNF-α reached 1007.1±98.3 and 1480.5±106.0 pg/mL, respectively, in the LPS group. PGF at 200 μg/mL reduced these concentrations to 581.9±82.9 and 944.5±208.3 pg/mL, corresponding to reductions of 42.2% and 36.2%. The IL-6 reduction was 425.17 pg/mL (95% CI 316.40–533.95), and the adjusted P values for the two endpoints were 0.001 and 0.016, respectively. The NO-related endpoint decreased from 32.09±3.00 to 17.34±1.85 μmol/L, and ROS decreased from 3.63±0.42-fold to 1.69±0.27-fold, with adjusted P values of 0.003 and <0.001, respectively. Mean viability across PGF concentrations ranged from 93.6% to 98.7%. At 50 μg/mL, the adjusted tests for IL-6, TNF-α, and ROS was not significant. The medium and high concentrations produced larger improvements, with means changing along a concentration gradient (Figure 3) (Table 5).
In TNF-α/IL-1β-injured Caco-2 monolayers, PGF at 200 μg/mL increased TEER from 45.72±8.17% to 69.33±9.76%, a gain of 23.61 percentage points (95% CI 12.38–34.83; adjusted P=0.021). FD4 Papp decreased from 3.78±0.54 to 1.92±0.55×10⁻⁶ cm/s (adjusted P=0.002). The FD4 difference at 50 μg/mL was not significant. Cytokine, ROS, and permeability responses consistently indicated more pronounced functional improvement at the high concentration.
Fractions Retain Anti-Inflammatory Activity, with Barrier Responses Maintained After Reconstitution
Mass recoveries of H and L were 65.58±2.96% and 27.53±2.71%, respectively, leaving 6.89±1.49% unrecovered. H, L, and R were applied at the prespecified fixed concentrations. Relative to the LPS model, H and L reduced IL-6 by 212.29 pg/mL (95% CI 129.17–295.41; Holm P=0.005) and 205.63 pg/mL (95% CI 63.98–347.29; Holm P=0.027), respectively. R reduced IL-6 by 289.83 pg/mL (95% CI 147.64–432.01; Holm P=0.010), showing that both fractions and their reconstituted preparation retained anti-inflammatory responses. The mean IL-6 differences between R and the whole preparation were 57.59 pg/mL (95% CI −120.29–235.48; Holm P=0.443). Group means and the TNF-α and ROS results are presented in (Table 6) (Figure 4).
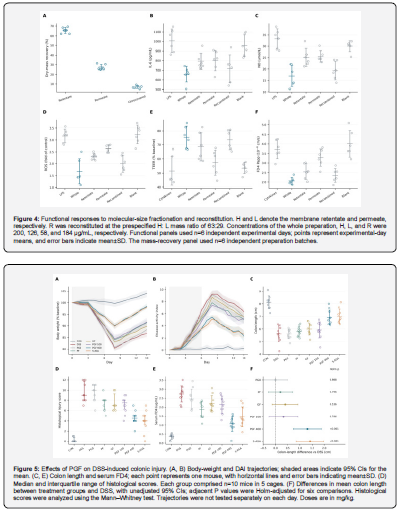
In the barrier assay, H increased TEER by 17.11 percentage points relative to the cytokine model (95% CI 8.39–25.84; Holm P=0.020), whereas the mean increase with L was 5.82 percentage points (95% CI −7.44–19.08; Holm P=0.620). Adjusted P values for FD4 were 0.054 and 0.313 for H and L, respectively. R increased TEER by 22.08 percentage points (95% CI 9.09–35.06; Holm P=0.025) and reduced FD4 Papp by 1.37×10⁻⁶ cm/s (95% CI 0.90–1.83; Holm P=0.003). This response distribution shows that both fractions retained anti-inflammatory activity, whereas concurrent improvement in TEER and FD4 occurred after reconstitution.
High-Dose PGF Improves DSS-Associated Colon Injury and Barrier Phenotypes
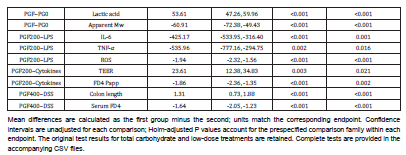
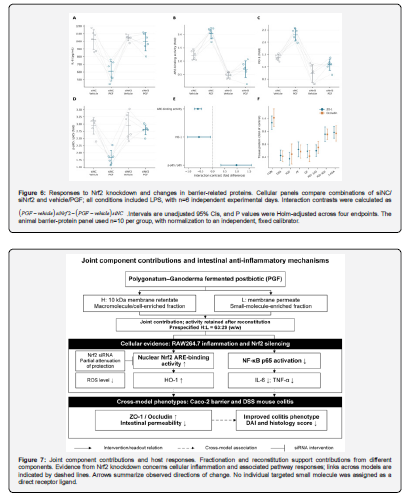
On day 14, body weight was 86.68±2.10% of baseline in the DSS group and 98.48±1.69% in the PGF 400 mg/kg group. DAI area under the curve was 76.55±4.74 and 38.85±6.86 score·d, respectively. Colon length increased from 5.60±0.63 cm in the DSS group to 6.91±0.59 cm with PGF at 400 mg/kg, giving a mean difference of 1.31 cm (95% CI 0.73–1.88; Welch t=4.79, df=17.91, P<0.001). The difference remained significant after Holm correction across six comparisons (P<0.001). Adjusted comparisons for colon length were not significant for PG0, PF, GF, or PGF at 100 mg/kg. Reanalysis of cage means gave the same high-dose PGF difference, with a 95% CI of 0.58–2.03 cm and adjusted P=0.025; the cage-bootstrap interval was 0.84–1.88 cm (Figure 5) (Table 7).
The mean histological score decreased from 9.6±2.0 in DSS mice to 4.6±1.3 with high-dose PGF, while serum FD4 decreased from 2.73±0.44 to 1.09±0.42 μg/mL. Tissue IL-6 decreased from 153.5±21.6 to 62.7±25.1 pg/mg protein. ZO-1 and Occludin were 0.75±0.11-fold and 0.75±0.08-fold, respectively, and were higher than in DSS mice. Tissue inflammation and barrier protein data are provided in (Table 8). These changes were consistent with improvements in colon length and disease activity.
Nrf2 Knockdown Attenuates the Inflammatory Modulation by PGF
In the concentration experiment, PGF at 200 μg/mL produced nuclear Nrf2 ARE-binding activity of 2.07±0.22-fold, HO-1 of 2.36±0.06-fold, and phosphorylated p65/total p65 of 1.58±0.20-fold. The corresponding LPS values were 1.19±0.31-fold, 1.42±0.38-fold, and 2.70±0.26-fold; all three adjusted P values were <0.05. In the Nrf2 intervention experiment, the relative total Nrf2 signal was 0.30±0.05 in the group and 1.10±0.18 in the group, confirming the knockdown condition.
In the siNC background, PGF reduced IL-6 from 1023.0±128.7 to 608.6±129.0 pg/mL. In the siNrf2 background, the corresponding values were 1046.6±38.1 and 995.3±118.2 pg/mL. The IL-6 interaction difference was 363.1 pg/mL (95% CI 83.2–643.0; adjusted P=0.041). The phosphorylated p65 interaction difference was 0.98-fold (95% CI 0.34–1.61; adjusted P=0.032). Interaction directions for Nrf2-binding activity and HO-1 likewise indicated attenuation after knockdown (Figure 6) (Table 9). Effects and intervals for the key prespecified comparisons are summarized in (Table 10).
Discussion
The functional responses to PGF accompanied fermentation-associated compositional redistribution: reducing sugars and apparent molecular mass decreased, lactic acid and total phenolic measures increased, and total carbohydrates remained similar. Both the membrane retentate and permeate retained IL-6 suppression, while reconstitution at the prespecified ratio retained both anti-inflammatory and barrier responses. Nrf2 knockdown further attenuated the IL-6 and p65 phosphorylation responses, locating the preparation's effects within cellular processes responsive to manipulation of host signaling.
Compositional interpretation depends first on the denominator. Fermentation consumes available sugars and converts part of the substrate into organic acids and microbial biomass. An increase per gram of freeze-dried powder therefore does not necessarily represent net production in the original system. Dual normalization makes this distinction measurable: dry-mass contents define exposure composition, whereas normalization to the original culture volume evaluates material recovery across processing. Thermal-processing studies have shown that Polygonatum polysaccharides and saponins vary with processing procedures [4]. Fermentation studies have also shown that lactic acid bacterial processing changes the physicochemical properties and bioactivity of P. kingianum polysaccharides. Wan et al. [16] observed changes in lactic acid, acetic acid, and multiple functional constituents in fermented soymilk containing Polygonatum, illustrating the need to retain information on both substrate and processing when evaluating combined fermentation products [15]. Splitting the same raw-material batches and applying identical terminal heat treatment focused the present comparisons on compositional and functional differences arising from a defined preparation process.
The reductions in reducing sugars and apparent molecular mass require separate interpretation. The former may include consumption of fermentable sugars, whereas the latter reflects changes in carbohydrate chains and other soluble macromolecules on the chromatographic calibration scale. Their concurrence does not identify the cleavage position of a particular glycosidic bond. Studies linking acetylated Polygonatum fructooligosaccharides to NLRP3-associated inflammation support further isolation of low-molecular-mass carbohydrate chains [3]. Work on the monosaccharide composition and prebiotic potential of Polygonatum polysaccharides also indicates that structural and utilization properties should be assessed at the fraction level [17]. The present compositional profile and activity distribution direct subsequent structural assignment toward fractions retaining activity, rather than toward interpretation of total carbohydrate content alone.
Component characterization in polysaccharide research also requires separation of composition, structure, and activity. Wang et al. [8] isolated an agavin-type fructan with a β-(2→1) backbone and β-(2→6) branches from fermented Polygonatum, connecting the linkage structure of an isolated fraction with the DSS phenotype [6]. Here, molecular-mass and monosaccharide measurements located compositional changes, while functional reassessment identified fractions for prioritized isolation. Combining these approaches reduces the tendency to designate a constituent as the principal active component solely because its abundance increases Ferulic acid and ganoderic acid. A served as targeted compositional markers. Their exposure concentrations should be calculated from whole-preparation concentration multiplied by constituent content, providing a basis for subsequent single-compound add-back experiments.
The functional distribution between H and L provides a direction for further separation. H retains more macromolecular and microbial biomass-associated components, which may influence inflammation through cell-surface recognition and local oxidative stress. L contains organic acids and other membrane-permeable small molecules that can more readily produce detectable metabolic and signaling responses in the cellular environment. The responses retained after reconstitution support a multicomponent basis for whole-preparation activity. This interpretation is consistent with the preparation-based definition of postbiotics: inanimate microorganisms and their components form part of the product rather than impurities that must be removed completely [9]. Evaluation and quality control should therefore consider the source strain, inactivation conditions, and preparation composition together [11].
Reconstitution also changes the basis of activity comparisons. Testing H and L separately at 200 μg/mL would increase the amount of each fraction beyond that supplied by the same volume of original preparation and compromise material comparability. The fixed H126, L58, and R184 μg/mL concentrations used here followed a prespecified mass ratio, so each fraction's effect reflects its contribution at that fixed composition. Differences between R and the whole preparation include dose, unrecovered material, and changes introduced by separation. Reductions relative to the model quantify the activity jointly retained by the fractions. Formal pharmacological synergy would require a concentration matrix and a prespecified additivity model. This comparison is more informative than inferring synergy solely from a smaller P value in the reconstituted group.
The cellular results distinguish anti-inflammatory effects from changes in survival and exposure conditions. When PGF reduced inflammatory cytokines and ROS, viability remained within an acceptable range, and sample background, medium pH, and osmolality were controlled. The decrease in inflammatory signals is therefore more consistent with functional modulation than with a passive consequence of extensive cell loss. The Caco-2 assay measured both TEER and FD4 transport. TEER captures barrier properties associated with ionic conductance, whereas FD4 assesses paracellular passage of a larger hydrophilic molecule. Improvement in both functionally consistent endpoints, despite their opposite numerical directions, provides a fuller account of barrier function than tight-junction protein expression alone.
Previous Ganoderma findings show that preparation method and intervention timing influence the outcome. Qiao et al. [18] fractionated polysaccharides from broken Ganoderma spores to obtain BGLSP-B2 and observed restoration of barrier proteins and changes in Th17/Treg-associated measures in a DSS model. Li et al. [19] found that a Ganoderma ethanol extract promoted recovery from DSS injury, whereas an aqueous polysaccharide preparation at 500 mg/kg did not improve the principal outcomes under their recovery-phase schedule. Ye et al. [20] administered ganoderic acids to DSS-treated mice and used cohousing and fecal microbiota transplantation to link part of the barrier improvement to microbiota changes [20]. Spore polysaccharides, fruiting-body extracts, and triterpenoids differ in composition and exposure conditions, so comparisons should focus on defined constituents and intervention start times. Holding total raw-material amount, fermentation procedure, and intervention timing constant attributes the present combined-preparation findings to these specified processing and exposure conditions.
Nrf2 knockdown reduced the mean PGF-associated decrease in IL-6 from 414.41 to 51.31 pg/mL, giving an interaction difference of 363.10 pg/mL (95% CI 83.21–643.00). The p65 phosphorylation response was attenuated concurrently, with an interaction difference of 0.98 (95% CI 0.34–1.61), showing that Nrf2 status modified the cellular anti-inflammatory response to PGF. Increased ARE-binding activity and HO-1 together with reduced ROS in the concentration experiment provide an oxidative stress context for the intervention result. Considering these concurrent responses alongside the knockdown interaction contrasts localizes whole-preparation activity to defined cellular processes.
The animal findings provide organ-level counterparts to the cellular observations. Colon length, histological score, and serum FD4 reflect overall injury, local tissue morphology, and barrier permeability, respectively. Their concordance with tissue inflammatory measures supports protection against mucosal injury during model induction. Body-weight and DAI trajectories also show how the response develops over the disease course rather than appearing only at a terminal measurement. Fermented single-substrate preparations at the same high dose provide comparators for the combined formulation, while the gradient between low- and high-dose PGF informs dose-related responses. Because dosing began with DSS exposure, the findings apply to intervention during inflammatory development and recovery rather than to a separate treatment schedule initiated after diagnosis.
The relationship between Nrf2 and inflammation extends beyond radical scavenging. Kobayashi et al. [21] found that Nrf2 suppressed macrophage inflammatory responses by blocking proinflammatory cytokine transcription, indicating an anti-inflammatory mechanism independent of changes in ROS. Xu et al. [22] further linked the anticolitic effects of Polygonatum polysaccharides to interactions between neutrophil extracellular traps and macrophages, with changes in TLR4–MAPK/NF-κB signaling [23]. These studies support interpreting the present Nrf2 intervention and p65 phosphorylation changes as part of immune-response regulation. Responses of both signaling pathways in the same system identify a temporal question for subsequent comparison of early transcriptional changes and later oxidative stress. Sato et al. [23] restored intestinal epithelial Nrf2 expression in a global Nrf2-knockout background and attenuated acute DSS injury, but did not observe the same between-group difference in their chronic model, indicating that cell type and disease duration influence the Nrf2 phenotype. Li et al. [24] used Nrf2-knockout mice and intestinal epithelial systems to examine curculigoside, providing a genetic-intervention reference for distinguishing pathway responses from mechanistic dependence [24]. The relationships among fractions, cellular pathways, and organ-level phenotypes are summarized in (Figure 7).
Cage housing is an easily overlooked source of shared exposure in animal studies. Cagemates share drinking water, microbial environments, and aspects of behavior, so treating all animals as fully independent replicates may underestimate uncertainty. Retaining both animal and cage identifiers and repeating the primary comparison using cage means subjected the primary endpoint to a more conservative assessment of environmental clustering. The six independent preparation batches and six independent cell-experiment days serve the same purpose: conclusions depend on replication of preparation and experimental processes rather than repeated readings from the same sample.
These findings define a practical sequence for preparation standardization. Raw-material ratio, strain, and culturability after terminal heat treatment should be established first, followed by concurrent tracking of dry-solids yield, carbohydrate molecular mass, and organic acid composition, and then batch consistency assessed through inflammatory and barrier endpoints. The ISAPP consensus links preparation characteristics to functional evaluation in the target host [10]. For this preparation, total carbohydrates or total phenolics alone are suitable for process monitoring, whereas efficacy assessment requires joint information on composition, fraction recovery, and function. Vinderola et al. [13] emphasized that postbiotic quantification should fit the preparation, considering both source microorganisms and functional components retained during manufacture. Boyte et al. [25] noted that plate counts measure culturability, whereas flow cytometry and nucleic acid methods capture different cellular properties; the quantification method should therefore match the measurement objective [25]. Here, culturability, normalization to original culture volume, and fraction recovery record culture status, product amount, and component distribution, respectively. Together, these measures provide a basis for subsequent batch comparisons.
Two focused questions remain for further work. First, differences between PGF and the unfermented control include both fermentation-associated biomass accumulation and changes in metabolites. Biomass-matched add-back and metabolite reconstitution would separate their contributions. Second, cellular knockdown identifies Nrf2 involvement, while tissue-specific effects in animals require corresponding genetic or pharmacological intervention. The present evidence directs subsequent work toward fractions retaining activity and defined host-response processes rather than further untargeted expansion of component screening.
Conclusion
Fermentation of the combined Polygonatum–Ganoderma substrate with L. plantarum followed by terminal heat treatment produced a preparation retaining inanimate microbial biomass and soluble products. PGF showed concordant improvements in macrophage inflammation, Caco-2 barrier function, and DSS-associated colon injury measures. Both membrane retentate and permeate retained anti-inflammatory responses, and reconstitution at the prespecified ratio retained both anti-inflammatory and barrier responses. Nrf2 knockdown attenuated PGF modulation of IL-6 and p65 phosphorylation, supporting a role for Nrf2 in its cellular anti-inflammatory response.
References
- Yuan Z, Wang X, Wang J, Xu Y, Chen J, et al. (2025) Polygonatum sibiricum polysaccharides attenuated colitis via regulating gut microbiota mediated colonic NLRP3/ASC/Caspase-1/GSDMD signaling pathway. Food Sci Hum Wellness 14(12): 9250291.
- Li H, Wu Y, Zhou Q, Wu P, Xing Y, et al. (2025) Polysaccharide from steamed Polygonatum sibiricum ameliorates ulcerative colitis by protecting the intestinal mucosal barrier and regulating gut microbiota. Int J Biol Macromol 301: 140343.
- Ding S, Chen J, Chen G, Tian W, Zheng J, et al. (2024) Preparation and structure characterization of a natural acetylated fructooligosaccharide from Polygonatum sibiricum and its alleviative effect on colitis by inhibiting NLRP3 pathway. J Funct Foods 113: 106027.
- Zhang Q, Lin X, Su W (2024) Study on the components changes of polysaccharides and saponins during nine steaming and drying of Polygonatum sibiricum. J Sci Food Agric 104(11): 6862-6874.
- Zhang P, Zhang H, Wu M, Li Y, Xia W, et al. (2024) Physicochemical properties, antioxidant and cardioprotective activities of polysaccharides from fermented Polygonatum kingianum with Lactobacillus species. Ind Crops Prod 216: 118699.
- Luo J, Jia M, Yang X, Chai Y, Bao Y (2024) Interaction between lactic acid bacteria and Polygonatum sibiricum saponins and its application to microencapsulated co-delivery. Food Chem 448: 138959.
- Cao W, Liu Y, Zhang Z, Xu X (2025) Lipid-lowering effects and metabolomic investigation of Polygonatum sibiricum fermented by Lactobacillus plantarum NX-1. Process Biochem 153: 102-109.
- Wang Q, Zhao W, Wu Y, Liao Y, Zhou W, et al. (2026) Preparation of an agavin-type fructan from Polygonatum sibiricum via fermentation-ultrafiltration and its effect on DSS-induced ulcerative colitis. Int J Biol Macromol 362: 152203.
- Cao W, Yang C, Feng Y, Zhang Z, Liu Y (2026) Evaluation of the antioxidant and anti-inflammatory efficacy of fermented Polygonatum sibiricum using zebrafish model. Biochem Biophys Rep 45: 102491.
- Guo W, Li Y, Han J, Liu X, Ni L (2026) Integrated Microbiome and Metabolomics Analysis Reveals That Ganoderma lucidum Triterpenoids Ameliorate Colitis Associated with the Modulation of the Gut Microbiota and Metabolic Profiles. Foods 15(11): 2016.
- Salminen S, Collado MC, Endo A, Hill C, Lebeer S, et al. (2021) The International Scientific Association of Probiotics and Prebiotics (ISAPP) consensus statement on the definition and scope of postbiotics. Nat Rev Gastroenterol Hepatol 18(9): 649-667.
- Vinderola G, Benkowski A, Bernardeau M, Chenoll E, Collado MC, et al. (2025) Postbiotics: a perspective on their quantification. Front Nutr 12: 1582733.
- Vinderola G, Sanders ME, Cunningham M, Hill C (2023) Frequently asked questions about the ISAPP postbiotic definition. Front Microbiol 14: 1324565.
- Chassaing B, Aitken JD, Malleshappa M, Vijay KM (2014) Dextran Sulfate Sodium (DSS)‐Induced Colitis in Mice. Curr Protoc Immunol 104: 15.25.1-15.25.14.
- Percie DN, Hurst V, Ahluwalia A, Alam S, Avey MT, et al. (2020) The ARRIVE guidelines 2.0: Updated guidelines for reporting animal research. PLoS Biol 18(7): e3000410.
- Wan P, Liu H, Zhu Y, Xin H, Ma Y, et al. (2023) Effects of Polygonatum sibiricum on Physicochemical Properties, Biological Compounds, and Functionality of Fermented Soymilk. Foods 12(14): 2715.
- Qi Z, Gao T, Li J, Zhou S, Zhang Z, et al. (2024) Structural characterization and prebiotic potential of polysaccharides from Polygonatum sibiricum. Food Sci Hum Wellness 13(4): 2208-2220.
- Qiao H, He J, Chen Y, Jin F, Huang Y, et al. (2025) Sporoderm-broken of Ganoderma lucidum spore polysaccharides alleviate dextran sulfate sodium-induced colon inflammation in mice by regulating Th17/Treg homeostasis and restore gut microbiota balance. Int J Biol Macromol 23(Pt 1): 147015.
- Li M, Yu L, Zhai Q, Liu B, Zhao J, et al. (2022) Ganoderma lucidum Ethanol Extraction Promotes Dextran Sulphate Sodium Induced Colitis Recovery and Modulation in Microbiota. Foods 11(24): 4023.
- Ye Y, Abulizi A, Zhang Y, Lu F, An Y, et al. (2025) Ganoderic Acid Ameliorates Ulcerative Colitis by Improving Intestinal Barrier Function via Gut Microbiota Modulation. Int J Mol Sci 26(6): 2466.
- Kobayashi EH, Suzuki T, Funayama R, Nagashima T, Hayashi M, et al. (2016) Nrf2 suppresses macrophage inflammatory response by blocking proinflammatory cytokine transcription. Nat Commun 7: 11624.
- Xu J, Zheng J, Ke W, Qiu Y, Zhang L, et al. (2026) Structural Characterization and Anti-Colitis Mechanisms of Polygonatum sibiricum Polysaccharides via Modulation of Neutrophil Extracellular Traps (NETs)—Macrophage Crosstalk. Nutrients 18(7): 1046.
- Sato T, To K, Sakurai F, Chihara K, Warabi E, et al. (2025) Intestinal epithelial cell-specific restoration of Nrf2 gene in whole-body-knockout mice ameliorates acute colitis. Exp Anim 74(3): 335-347.
- Li F, Huang H, Zhao P, Jiang J, Ding X, et al. (2023) Curculigoside mitigates dextran sulfate sodium‑induced colitis by activation of KEAP1‑NRF2 interaction to inhibit oxidative damage and autophagy of intestinal epithelium barrier. Int J Mol Med 52(5): 107.
- Boyte ME, Benkowski A, Pane M, Shehata HR (2023) Probiotic and postbiotic analytical methods: a perspective of available enumeration techniques. Front Microbiol 14: 1304621.