




 AJPR Home


Abstract
Various discharge modes in atmospheric air, including those at low pressures (units and fractions of a Torr), are currently being extensively studied. Specifically, the spectral and optical properties of both large-scale high-altitude discharges (red sprites, blue jets, giant blue jets, and others) in the Earth's atmosphere and relatively small laboratory discharges are being investigated. Diffuse discharge modes in low-pressure air typically produce radiation in the ultraviolet, visible, and infrared spectral regions, which correspond to the bands of the second positive (2+), first positive (1+), and first negative (1–) systems of the nitrogen molecule and ion. This paper presents the results of spectral and optical studies of a streamer pulse-periodic discharge in moist air, water vapor and their mixtures, and in hydrogen at pressures of units and fractions of a Torr. It has been shown that a broadband continuum is detected in the radiation of low-temperature plasma of moist air and water vapor on the transition of molecular hydrogen (H2(a3Sg+) → H2(b3Su+). It has been established that the spectral energy density of the continuum radiation increases with decreasing air pressure and increasing its relative humidity.
Key words: Atmospheric Air; Low-Pressure; Water Vapor; Pulsed Discharges; Hydrogen Continuum
Introduction
Data on the properties of the Earth's atmosphere are of great practical importance for human life. This information is constantly expanding and being refined through the use of new research methods and sophisticated equipment, as well as satellites and the International Space Station. One area of research is the study of the emission spectra and optical characteristics of pulsed discharges in low-pressure air. In particular, over the past three decades, much attention has been paid to studying the properties of high-altitude discharges, primarily red sprites, in the Earth's atmosphere [1-3]. In laboratories, long tubes are often used to study low-pressure discharges [4-7]. Much attention is paid to the study of streamer discharges, which may be miniature analogues of red sprites [8]. In many studies, significant efforts are directed toward studying the spectral characteristics of low-pressure streamer discharges, see, for example, [3,8,9].
In our study of miniature analogues of red sprites, we discovered the influence of air humidity on the discharge color and its emission spectrum, see work [10]. The main change in these characteristics occurred due to the appearance of a broadband continuum, which had significant intensity in the visible spectral region and determined the discharge color. More detailed studies, the results of which are presented in work [11], allowed us to put forward the hypothesis that the continuum recorded in humid air belongs to the emission of molecular hydrogen between its bound and repulsive terms (H2(a3Sg+) → H2(b3Su+). In addition, in 2026 a report appeared about the observation of broadband emission during a discharge in humid air at atmospheric pressure, which was also attributed to the emission of molecular hydrogen [12]. The additional continuum emission spectra recorded in work [12] were the same in dry air with a small part (1.5 Torr) of hydrogen and in air with relative humidity 25%.
It should be noted that hydrogen continuum radiation is well known and continues to be studied. Thus, in work [13,14], it was shown that a glow discharge in low-pressure hydrogen emits a broadband continuum in the UV and visible regions of the spectrum; data were also obtained on the influence of electron temperature on processes in the discharge plasma.
When excited by an electron beam, broadband hydrogen continuum radiation was observed in high-pressure neon with small additions of hydrogen [15]. In addition, in work [15] it was shown that, simultaneously with the hydrogen continuum radiation, the emission of the atomic hydrogen line Hα appears. Broadband continua of radiation were also observed during a discharge in water vapor bubbles [16,17] and in water vapor [18,19], but the nature of the radiation recorded in these works remained unestablished.
The aim of this work is to study the conditions for the appearance of a broadband continuum in low-pressure humid atmospheric air and to find new arguments confirming that it belongs to the emission of molecular hydrogen on the transition H2(a3Sg+) → H2(b3Su+).
Experimental set-up and measurement methods
The experiments were carried out on a setup similar to that previously used to study the emission properties of miniature red sprites in a streamer discharge, in particular to model their emission spectra [8,10]. This setup was also used to study the broadband emission in low-pressure moist air [11]. Its diagram is shown in Figure 1.
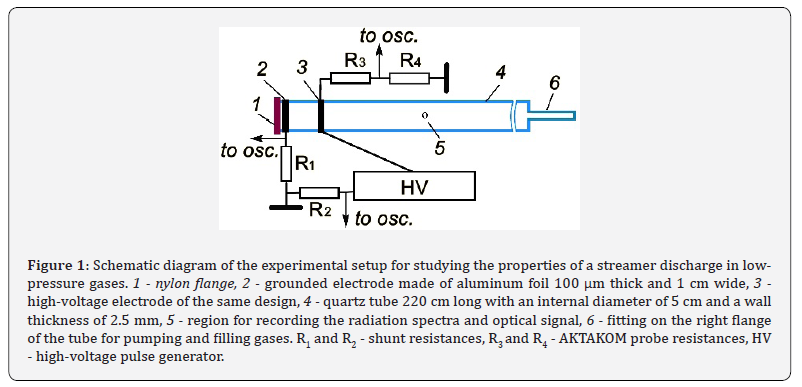
A discharge in humid air, water vapor, air-water vapor mixtures and hydrogen was ignited in tube 4 made of GE-214 quartz, which has low absorption in the ultraviolet, visible, and near-infrared spectral regions. The axis of the quartz tube was located 18 cm from the surface of the metal plate of the experimental setup. A high-voltage pulse generator (HV) with a discharge current pulse duration of up to 5μs was used to excite the discharge. The generator operated in a pulse-periodic mode with an adjustable pulse repetition rate. The first half-period of the voltage pulse with a rise and fall of ≈0.4μs had a half-maximum duration of ≈1.5μs. The generator could produce voltage pulses of both positive and negative polarity. Their amplitude in open-circuit mode was ≈10 kV. When igniting a discharge in pulse-periodic mode, starting with a pulse repetition rate of ~100Hz, the voltage amplitude decreased. High-voltage pulses from the generator were applied to the outer ring electrode 3, and the grounded terminal of the generator was connected to electrode 2 via shunt R1. Most of the experiments were conducted at a pulse repetition rate of 20 kHz.
The voltage across the discharge gap was measured with an AKTAKOM ACA-6039 probe, and the discharge current was measured with shunts R1 and R2 with a resistance of 20 ohms. The resistances of the high-voltage and low-voltage arms of the voltage divider in the probe were 900 ohms and 900 megaohms, respectively. Electrical signals were recorded with an MDO 3104 digital oscilloscope (1GHz, sampling frequency 5 Gs/s). The gas volume inside the tubes was pre-evacuated with a fore vacuum pump and then filled with atmospheric air, water vapor, a mixture of water vapor and air, which had a relative humidity of »20% before mixing, or hydrogen. Gas pressures p from 0.05 to 3 Torr were used in the experiments. Accordingly, the plasma-forming medium in the main experiments was either laboratory air with a relative humidity of »20%, water vapor, or a mixture of air and water vapor. Additionally, in some experiments, the quartz tube was filled with hydrogen with an impurity content of no more than 0.01%. The studies were conducted at a laboratory temperature of » 23°C.
The discharge was photographed using a Canon EOS 2000D SLR camera (24.7 MP, 22.3 x 14.9 mm2 matrix, 3.72 µm pixel size). The camera exposure time was a few fractions of a second, sensitivity was 1600 ISO at aperture 5.6. To record the spectral distribution of plasma radiation energy, a portable spectrometer HR2000+ES (Δλ = 200–1150 nm; δλinstr » 0.9 nm) was used. The spectrometer sensitivity was calibrated using a deuterium lamp. Radiation was supplied to the spectrometer through a 5-cm-long black plastic tube with an internal diameter of 0.9 cm. Due to the spectrometer with the plastic tube, radiation was recorded from the central regions of the discharge, 1 cm in diameter, on the axis of the quartz tube. The center of this region, when recording radiation spectra, was typically located 20 cm from the right edge of electrode 3. Radiation in this region was determined by plasma diffuse jets (PDJs), initiated by the plasma of the preliminary discharge between electrodes 2-3.
The radiation time course was measured using photomultiplier tubes (PMTs) — silicon PMTs (SiPMs) in the MicroFC-SMA-10035 module. The PMT transient response rise time was 0.3 ns, and the cell recovery time was 180 ns. The PMT spectral sensitivity peaked at » 460 nm and gradually decreased to 10% at 320 and 750 nm, respectively, in the UV and IR spectral regions. The PMTs were also used to record radiation from a discharge region with a diameter of ≈1 cm. This was achieved through the use of a quartz light guide with a lens at its end. The center of this region was located 20 cm from the right edge of electrode 3. External lighting in the laboratory was turned off when recording emission spectra or radiation time course.
Results
When the generator was turned on for a period of time ranging from a few to tens of minutes, depending on the air pressure and humidity, the discharge color was red at low pressures, but turned blue as the pressure increased to tens of Torr. Figure 2a shows a photograph of a pulsed-periodic discharge in air at a pressure of p = 1 Torr, obtained during a short generator run.
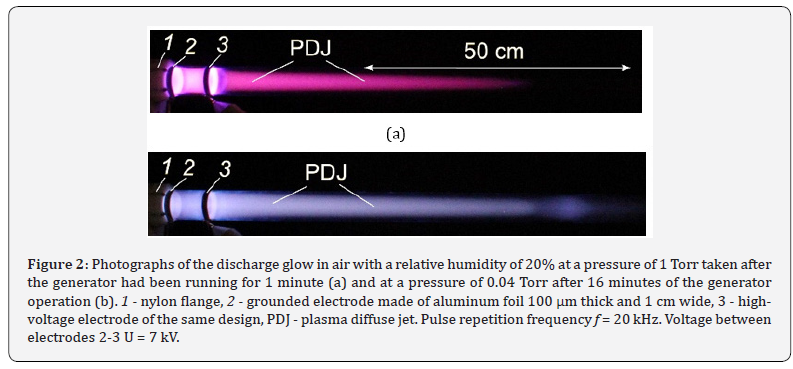
The discharge color, as in our previous studies [8,10,11], was red at a pressure of 1 Torr and the color was determined by the emission of bands on transitions of the first positive system of nitrogen in the red region of the spectrum. Note that the discharge color at an air pressure of about 1 Torr and a pulse repetition rate of 20 kHz did not change significantly over a period of tens of minutes. However, by varying the generator turn-on time, the study data showed that with a significant increase in the generator operating time, the discharge radiation color begins to smoothly change from red to white. In addition, it was found that the change in discharge color occurs more quickly with a decrease in the air pressure admitted to the quartz tube and an increase in its relative humidity. It was also found that with an increase in the specific energy input into the gas due to an increase in the voltage pulse repetition rate, the discharge color change occurs in a shorter time. A photograph of the discharge radiation, which changed color after turning on the generator for 16 minutes at a frequency of 20 kHz, is shown in Figure 2b. It is evident that the discharge color became white with a blue tint along the entire length of the plasma diffuse jet and between electrodes 2-3. However, it did not differ significantly in the region between the electrodes and in the PDJ, whereas at a pressure of 1 Torr the glow of these regions was noticeably different. It is also evident from Figure 2b that a dark region appeared at the end of the PDJ, behind which the radiation intensity increased again, having the shape of a small cloud. A similar change in the shape of the ends of red plasma diffuse jets was previously observed in [8] with negative polarity of the generator voltage pulses. The length of the PDJ depended on the pressure and composition of the gas. With a decrease in air pressure with a relative humidity of 20% from 1 Torr to ~0.05 Torr, it increased more than twofold and reached the right end of quartz tube 4. With a further decrease in pressure, its length smoothly began to decrease. Figure 2b shows a photograph of a reduced-size PDJ. Under these conditions, due to the lower pressure, the color change of the PDJ occurred in a shorter time. Figure 2
The current and voltage pulses during the formation of plasma diffuse jets were similar for air and its mixtures with water vapor, as well as for hydrogen and water vapor without mixing with air. An example of waveforms of voltage pulses, discharge current, and radiation from a region located 20 cm from the right edge of electrode 3 is shown in Figure 3.
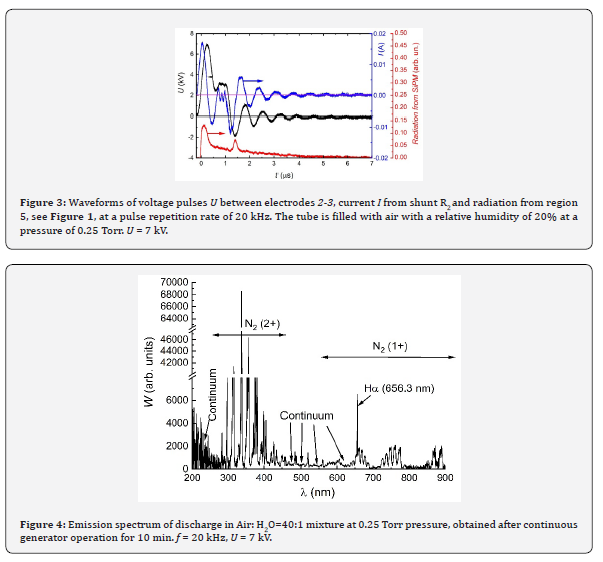
As we have already noted, when high voltage pulses are applied from the generator to electrode 3, a capacitive discharge limited by two barriers is formed between it and electrode 2. Plasma diffuse jets are initiated due to streamers from the plasma of this discharge when the pressure decreases, starting from 3 Torr. A discharge was observed only between electrodes 2–3 and no PDJs were formed at higher air pressure. In the mode shown in Figure 3, two streamers were initiated, the passage of which through the plasma region opposite the photomultiplier resulted in the registration of two emission peaks. With a change in pressure, the number of emission peaks could vary from one to four. The maximum discharge current density between electrodes 2 and 3 with a change in pressure, for the conditions in Figure 3, reached » 50 mA/cm2, and in tube 4 at a distance of 20 cm from the right electrode 3 it was » 30 mA/cm2. The voltage across the gap remained virtually unchanged for 16 minutes of generator operation, while the discharge current decreased by approximately 10%. Similar waveforms of voltage and current pulses, recorded in a pulse-periodic mode using a similar setup, were presented in [8, 11]. The radiation pulses from the PDJ had two components. One of these, with a duration of up to 10 μs, was determined by the emission of the 1+ bands of the nitrogen system in the red spectral region, while the second, short pulses (peaks) correlating with the current peaks with the highest amplitude, was determined by the emission of the continuum and the 2+ bands of the nitrogen system.
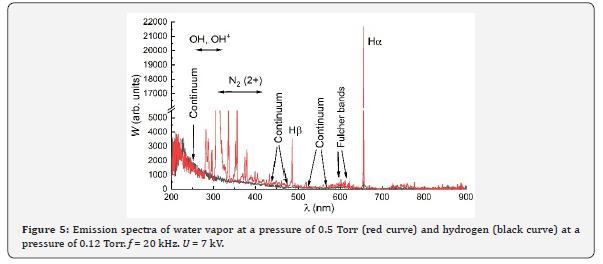
The emission spectrum of the discharge in a mixture of air and water vapor, obtained at a distance of 20cm from the right edge of electrode 3 after 10 minutes of generator operation, is shown in Figure 4.
The 2+ nitrogen system bands with wavelengths of 337.1, 357.8 and 315.8 nm exhibit the highest radiation intensity under these conditions. The 1+ nitrogen system bands in the red and near-infrared spectral regions, as well as, the atomic hydrogen line with a wavelength of 656.3 nm, are also clearly visible. In addition to these well-known emission bands and lines, a broad continuum is recorded in the range from 200 to 700 nm. The formation of this continuum due to its emission in the range of 400–650 nm leads to a significant change in the color of the discharge plasma, which becomes white. Table 1 presents the values of the spectral radiation energy density W for the continuum at a wavelength of 495 nm and for the 1+ nitrogen system band with a wavelength of 661 nm, depending on the generator operating time. The wavelength of 495 nm was chosen because there were no bands and lines from other transitions in this region.
The measurements show that the spectral energy density of the continuum radiation increases with increasing energy deposited in the gas, while the intensity of the nitrogen 1+ band decreases. This behavior is observed in all regions of the continuum where the radiation of other bands and lines does not overlap. For other nitrogen 1+ bands, similar changes in the radiation spectrum are recorded both in the red and near-infrared spectral regions. In the 400–650 nm range, the continuum and nitrogen 1+ bands become approximately equal after 10 minutes of generator operation (see Figure 4). Accordingly, the nitrogen 1+ bands no longer determine the color of the plasma diffuse jets. It should be noted that during prolonged generator operation, the gas pressure in the quartz tube increased approximately twofold. However, the particle concentration did not change significantly. This is due to the fact that the volume of the quartz tube was more than an order of magnitude greater than the volume of the connecting hoses.
In addition to the spectral characteristics of the radiation of moist air and mixtures of air with water vapor, a separate study of the spectra of a discharge in hydrogen and water vapor was performed. The obtained results are shown in Figure 5.
By varying the gas pressure, conditions were selected under which the broadband continuum emission intensities in the UV and visible spectral regions were approximately the same for both gases. It was previously established that the spectral energy density of the continuum emission increased with decreasing pressure. A comparison of the continuum emission spectra showed that their shape was maintained with pressure and was approximately the same for the given conditions during excitation of hydrogen and water. Differences were observed only in the spectral energy densities of the bands and lines accompanying the continuum emission. Thus, in hydrogen, the emission intensities of the atomic hydrogen lines at λ = 656.3 nm (Hα) and 486.1 nm (Hβ) were an order of magnitude or lower than their intensities in water vapor. However, the intensity of the Fulcher bands in hydrogen was several times greater. In addition to Hα and Hβ, the water vapor spectrum contained intense emission bands of OH and OH+ molecules with maximum W at wavelengths of λ = 312.6 nm and λ = 308.2 nm, respectively. Relatively weak bands of the 2+ nitrogen system were also visible at wavelengths of 337.1 and 357.8 nm, the appearance of which was associated with the absorption of air by the water used to generate its vapor. The discharge color in water vapor and hydrogen was white and did not differ significantly. As can be seen from the spectrogram in Figure 5, in the wavelength range of 400–650 nm, the main contribution to the emission comes from the hydrogen molecule continuum.
Discussion
Previously in [8], we reported a change in the color of the PDJ discharge from red to white with decreasing air pressure. Furthermore, in that work, with a change in the discharge color in the visible spectrum, an increase in the spectral energy density of the broadband continuum radiation was recorded. When air was replaced with nitrogen, the PDJ color remained red under similar conditions. However, the physical cause that led to the change in the PDJ color in [8] was not established. In a recent paper [11], it was hypothesized that this continuum belongs to the emission of hydrogen molecules between the bound and repulsive terms (H2(a3Sg+) → H2(b3Su+). As is known, to obtain white emission, a certain combination of red, green and blue colors or broadband emission, relatively uniformly distributed over the visible wavelength range, is required. As can be seen from the spectrum in Figure 4, the continuum emission covers the spectral region of 400 – 650 nm. In this area, individual bands and lines of relatively low intensity are also observed. However, the white color of the discharge under these and similar conditions, see Figure 2b, is determined by the continuum emission, see Figure 4, the spectral energy density of which is almost uniformly distributed over the entire visible range. As we have already noted above, when using dry air over a wide pressure range, and also, which is very important, with a short operating time of the generator, the initial color of the discharge is red. In humid air, it begins to change and turns white when the generator is on for long periods; see the photograph in Figure 2b.
The change in discharge color during generator operation occurs gradually, and this process depends on the energy deposited in the gas, for example, due to the pulse repetition rate. The increase in continuum emission intensity is illustrated by Table 1, which presents the spectral energy densities of emission at a wavelength of 495 nm for two air-water vapor mixtures of different compositions. These data were obtained by processing emission spectra recorded sequentially after 1, 6, 12, and 16 minutes of the generator operation. The broadband emission energy densities W increased by approximately an order of magnitude during this time, while the W of the 1+ bands of the nitrogen system decreased under the same conditions, but by no more than a factor of two. Thus, the change in the emission spectrum and discharge color is explained by the appearance of broadband continuum emission. The experiments also indicate that the emitting particles, responsible for the continuum, are gradually generated in the quartz tube and are excited in subsequent pulses. Table 1
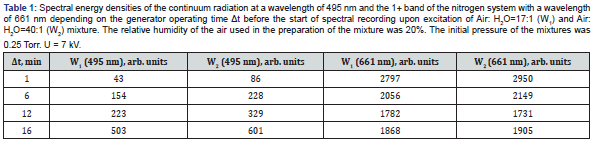
In [11], N. Popov proposed that the main channel for producing hydrogen molecules in a low-pressure moist air discharge plasma is the heterogeneous recombination of hydrogen atoms on the walls of the discharge tube. The resulting hydrogen molecules are then excited in subsequent voltage pulses and emit radiation on the transition H2(a3Sg+) → H2(b3Su+) + hv. From the experiments in [11], it followed that when hydrogen molecules are formed from water vapor, a fairly intense emission of OH molecules (λ = 312 nm), OH+ (λ = 308.2 nm) and hydrogen atoms (λ = 486.1 nm, 656.3 nm) appears in the discharge spectrum. These bands and lines are clearly visible when water vapor is excited, see Figure 5 (black curve), as well as works [8,10]. In this case, the appearance of broadband continuum radiation correlates with the appearance of hydrogen atom radiation at a wavelength of 656.3 nm, see Figure 4 and Figure 5. In the work [8], an oxygen line at λ = 777.1 nm was also recorded.
An important argument proving that the observed continuum belongs to the emission of hydrogen molecules is the coincidence of the emission spectra of the discharge in hydrogen and in water vapor, which is demonstrated in Figure 5.
Moreover, the emission spectrum of hydrogen (black curve), obtained in the present work, down to the smallest details, coincides with the well-known emission spectrum of hydrogen molecules, which is given in Figure 3a in recent work [13]. Thus, the emission spectrum of the continuum in water vapor is identical to the obtained and known emission spectra observed in hydrogen at low pressures. In particular, in the spectra in the region of about 600 nm, which are shown in Figure 5, the Fulcher bands of the hydrogen molecule are clearly visible, and their intensity, as it should be, is greatest upon excitation of pure hydrogen. On the other hand, upon excitation of water vapor, the intensity of the atomic hydrogen lines Hα and Hβ is significantly greater than in pure hydrogen. It follows that, during the dissociation of water vapor, atomic hydrogen is initially formed, which combines into H2 molecules. High-intensity emission during excitation of water vapor is also exhibited by the OH bands (the most intense with λ = 312 nm) and OH+ (the most intense with λ = 308.2 nm), which have previously been observed in many studies, see, for example, [18,19]. As we have already noted, the simultaneous appearance of the continuum emission and hydrogen Hα line was discovered in the work of Wieser [15] during excitation of high-pressure neon with hydrogen additives by an electron beam. These results also indirectly confirm the formation of a hydrogen continuum in low-pressure moist air under our conditions.
To summarize, it can be stated that the continuum recorded in humid air upon excitation by a pulse-periodic streamer discharge belongs to the emission of molecular hydrogen between the bound and repulsive terms (H2(a3Sg+) → H2(b3Su+).
The manifestation of a broadband continuum in atmospheric high-altitude discharges that form at low air pressures can be expected in the emission of blue jets [20], primarily in the region above dense clouds, where they originate and have the smallest transverse dimensions. In this region, the water vapor content remains comparatively high and the highest discharge current densities are realized. We were unable to find data on the emission spectrum of blue jets or giant blue jets [21] with the presence of a hydrogen continuum in them in the known literature. However, integral photographs of the emission of blue jets show a white discharge color, see, for example, Figure 3 in [20]. The change in discharge color above thunderclouds is more pronounced in giant blue jets. This can be explained, as already noted, by the long durations and amplitudes of the discharge currents during their formation [21,22]. Regarding the emission of red sprites, their lower limit of propagation lies at an altitude of approximately 40 km above sea level (see [1-3]), where the water vapor concentration is low. Therefore, in photographs of sprites at altitudes above 50 km, they appear red, while at altitudes of 40–50 km, their emission takes on a blue tint.
In [23], during a corona discharge in atmospheric air, we recorded radiation whose spectrum corresponded to that of the hydrogen continuum. The color of the radiation became white. Based on the present studies and data available from the literature, we assume that not only the recombination but also the hydrogen continuum should contribute to lightning radiation [24,25]. As is known, lightning is observed during thunderstorms in the lower and middle regions of the Earth's atmosphere, and the color of lightning radiation is usually white with a bluish tint; see, for example, Figures 2 and 3 in [25].
Introduction
The experimental studies performed and the analysis of the results known from the literature have shown the presence of broadband continuum radiation of hydrogen in humid air. It has been shown that an increase in the intensity of its radiation at low pressures, tenths to hundredths of a Torr, and with an increase in the time of exposure of the gas to a pulsed-periodic discharge. A comparison of the emission spectra of humid air, water vapor, their mixtures, and hydrogen shows that the continuum radiation belongs to the emission of hydrogen molecules between the bound and repulsive terms (H2(a3Sg+) → H2(b3Su+). This broad band is present in various gases and with various excitation methods; see, for example, the data on the excitation of high-pressure neon with a continuous electron beam [15].
The presence of broadband hydrogen continuum emission indicates the presence of water vapor, and in some cases hydrogen, in the source gases and/or the formation of water and hydrogen vapor due to desorption from the walls of the discharge chambers, as well as the electrodes during their contact with the discharge plasma. Accordingly, the appearance of a broadband hydrogen continuum must be taken into account when processing spectral data, particularly when determining electron temperature and developing new kinetic models.
Acknowledgement
This work was carried out using financial support within the framework of the State Assignment of the HCEI SB RAS, project # FWRM-2026-0008.
The authors are thankful to N.A. Popov for useful discussions and to D.S. Pechenitsin for the development and creation of the pulse generator with a high repetition rate.
Conflict of Interest
The authors declare that the research was conducted in the absence of any commercial or financial relationships that could be construed as a potential conflict of interest.
References
- Surkov VV, Hayakawa M (2020) Progress in the study of transient luminous and atmospheric events: A review. Surveys in Geophysics 41(7): 1101–1142.
- Gordillo-Vázquez FJ, Pérez-Invernón FJ (2021) A Review of the impact of transient luminous events on the atmospheric chemistry: Past, present, and future. Atmospheric Research 252: 105432.
- Stenbaek‐Nielsen HC, McHarg MG, Haaland R, Luque A (2020) Optical Spectra of Small‐scale Sprite Features Observed at 10,000 fps. Journal of Geophysical Research: Atmospheres 125(20): e2020JD033170.
- Vasilyak LM, Kostyuchenko SV, Kudryavtsev NN, Filyugin IV (1994) Fast ionization waves under electrical breakdown conditions. Physics-Uspekhi 37(1): 247–268.
- Goto Y, Ohba Y, Narita K (2007) Optical and spectral characteristics of low-pressure air discharges as sprite models. J. Atmos Electricity 27(2): 105–112.
- Anikin NB, Zavialova NA, Starikovskaia SM, Starikovskii AY (2008) Nanosecond-discharge development in long tubes. IEEE Transactions on Plasma Science 36(4): 902–903.
- Huang B, Zhang C, Qiu J, Zhang X, Ding Y, Shao T (2019) The dynamics of discharge propagation and X-ray generation in nanosecond pulsed fast ionisation wave in 5 mbar nitrogen. Plasma Sources Science and Technology 28(9): 095001.
- Tarasenko V. Vinogradov N, Baksht E, Sorokin D (2022) Experimental simulation of red sprites in a laboratory. Journal of Atmospheric Science Research 05(3): 26–36.
- Ionikh YZ (2020) Electric breakdown in long discharge tubes at low pressure. Plasma Phys Rep 46(10): 1015–1044.
- Tarasenko VF, Baksht EK, Vinogradov NP, Sorokin DA (2022) Emission spectra of low-pressure air during a diffuse streamer discharge. Optics and Spectroscopy 130(12): 1769–1777.
- Tarasenko VF, Popov NA, Baksht EKh, Panchenko AN (2026) Radiative continuum of molecular hydrogen in a diffuse pulse-periodic discharge in low-pressure humid air. Plasma Phys Rep 52(2): 208–216.
- Beloplotov DV, Tarasenko VF, Panchenko AN, Sorokin DA (2026) Effect of air humidity on emission of nanosecond discharge during point-to-point gap breakdown. Uspekhi Pricladnoi Fizikhi 14(1): 41–51.
- Smith WH, Chevalier R (1972) Radiative-lifetime studies of the emission continua of the hydrogen and deuterium molecules. Astrophysical Journal 177: 835-839.
- Nunomura S, Ezumim N (2024) Electron temperature characterization of H2 processing plasma by optical emission spectroscopy. Appl Phys Express 17(11): 116001.
- Wieser J (2025) UV continuum and hydrogen line-emission in hard ionized, high-pressure neon. Proceedings of the 17th Int. Conf. AMPL-2025, 14–20 September 2025: Russia (Tomsk) 18–19.
- Simeni Simeni M, Luo Y, Bruggeman PJ (2025) On the origins of the continuum radiation of an underwater nanosecond pulsed discharge: an Absolute-intensity optical emission spectroscopy study. Plasma Sources Science and Technology 34(2): 025003.
- Guo J, Wang Y, Zhou N, Lin X, Liu J, et al. (2026) Non-thermal air bubble discharge in water for atmospheric nitrogen fixation: Mechanistic insights from experiments and simulations. Journal of Physics D: Applied Physics, 59(13): 135204.
- Vul’ AY, Kidalov SV, Milenin VM, et al. (1999) New efficient low-pressure gas-discharge source of optical radiation using hydroxyl OH. Phys Lett 25(1): 4–6.
- Shuaibov AK, Dashchenko AI, Shevera IV (2001) Stationary radiator in the 130–190 nm range based on a water vapour plasma. Quantum Electron 31(6): 547–548.
- Chanrion O, Neubert T, Mogensen A, Yair Y, Stendel M, et al. (2017) Profuse activity of blue electrical discharges at the tops of thunderstorms. Geophys. Res Lett 44(1): 496–503.
- Soula S, van Der Velde O, Montanya J, Huet P, Barthe C, Bór J (2011) Gigantic jets produced by an isolated tropical thunderstorm near Réunion Island. Journal of Geophysical Research: Atmospheres 116(D19): D19103.
- Su HT, Hsu RR, Chen AB, Wang YC, Hsiao WS, et al. (2003) Gigantic jets between a thundercloud and the ionosphere. Nature 423(6943): 974–976.
- Kozyrev AV, Kozhevnikov VY, Kostyrya ID, Rybka DV, et al. (2012) Radiation from a diffuse corona discharge in atmospheric-pressure air. Atmospheric and Oceanic Optics 25(2): 176–183.
- Montanyà J, Van Der Velde O, Williams ER (2014) Lightning discharges produced by wind turbines. Journal of Geophysical Research: Atmospheres 119(3): 1455-1462.
- Kieu N, Gordillo-Vázquez FJ, Passas M, Sánchez J, PérezInvernón FJ (2021) High-speed spectroscopy of lightning-like discharges: Evidence of molecular optical emissions. Journal of Geophysical Research: Atmospheres, 126, e2021JD035016.

























