Influence of The Laser Power and Scan Spacing on The Mechanical Properties of PA12 Using Various Orientations of Specimens in The Selective Laser Sintering
Matija Hriberšek, Rebeka Lorber and Blaž Nardin*
Faculty of Polymer Technology (FTPO), Ozare, Slovenj Gradec, Slovenia
Submission: May 10, 2024; Published: May 27, 2024
*Corresponding author: Blaž Nardin, Faculty of Polymer Technology (FTPO), Ozare, Slovenj Gradec, Slovenia, Email: blaz.nardin@ftpo.eu
How to cite this article: Matija Hriberšek, Rebeka Lorber and Blaž Nardin*. Influence of The Laser Power and Scan Spacing on The Mechanical Properties of PA12 Using Various Orientations of Specimens in The Selective Laser Sintering. Academ J Polym Sci. 2024; 6(4): 555686. DOI: 10.19080/AJOP.2024.06.555686
Abstract
When designing a product in its early stage of development, the selection of material and knowledge of its properties, together with the conceived design, is key. Additive manufacturing allows engineers to efficiently design components, with unlimited possibilities in their design, which can be reflected in the use of technology for series in real production or for rapid prototyping of products, where engineers check their design solutions on the product or the prototype is tested in a laboratory environment. The paper presents the influence of laser power and scan spacing on the comprehensively described mechanical properties of standard test specimens made of PA12 material with selective laser sintering technique (SLS). For the most promising process combination in terms of the highest mechanical characteristics of specimens, the influence of the build orientation of the fabrication process on the mechanical properties of the same name was investigated. The results showed that the influence of scan spacing is much more significant than the influence of the laser power on the mechanical properties, but it is necessary to ensure a sufficiently high laser power for the sintering of the material to occur. In summary, the orientations of samples placed flat on the work surface and rotated by 90 have the most favorable influence on the best resistance to Charpy impact strength. and thus, the greatest elongations. Thus, when describing the tensile properties, there is a smaller influence of the difference between the orientations.
Keywords: Polyamide 12; Selective laser sintering; Mechanical properties; Build orientation; Real mechanical components
Abbreviations: SLS: Selective Laser Sintering; NVH: Noise, Vibration and Harshness; XAXD: X-Ray Diffraction; PA12: Polyamide 12
Introduction
The principle of producing objects using additive manufacturing technologies is based on the creation of three-dimensional objects by applying materials, usually in layers. In recent decades, the number of research and studies in the field of additive manufacturing technologies has increased, more precisely in the field of research into new materials and technological process parameters that correlate with the mechanical, thermal, and tribological behavior of objects produced in 3D.
Selective laser sintering is one of the powder bed fusion technologies in which laser beam melt and fuse material powders. In SLS technology, the powder is sintered layer by layer. Selective laser sintering (SLS) is one of the most widely used additive manufacturing technologies in modern engineering environments such as technical institutes, prototyping workshops, industry and academic research laboratories. SLS technology enables the production of 3D objects using different types of base materials such as metal, ceramic or polymer powder and possibly glass. Carbon reinforcement is added to the polymer matrix to improve the mechanical, thermal and tribological behavior of the 3D manufactured parts. In terms of part design complexity, with SLS, as with other additive manufacturing technologies, there are almost no limits to the ability to produce parts. SLS technology enables the production of thin-walled 3D objects with a wall thickness of less than 1 mm, but also up to 0.7 mm while ensuring the dimensional accuracy and precision of the manufacturing process. SLS machines can also produce parts with larger dimensions, such as 500 mm in all axes, which is an advantage of the process in the production of complex plastic structures, especially housings for various devices in the development phase of prototyping concepts. The polymer powders commonly used are based on polyamide PA and are engineering plastics with low weight and inertia, wear resistance, good chemical and corrosion resistance and improved noise, vibration and harshness (NVH) behavior.
Brighenti et al. gave an overview of the state of the art in the field of laser-based additive manufacturing of polymers, including powder bed fusion technology. The authors gave a theoretical overview of the selective laser technique and the influence of the process parameters on the physical properties of the final 3D part and established a correlation with the mechanical properties. In addition, important physical parameters such as porosity and degree of curing in SLS and processing parameters are discussed in the review [1]. Hupfeld et al. introduced nano additives, in particular metal and oxide nanoparticles, into the polymer powder PA12 to improve the properties of the manufactured material using the SLS technique. To prevent agglomeration of the nanofiller, a new approach was developed in which surfactantfree, laser-generated colloidal nanoparticles are absorbed directly onto the polymer surface in an aqueous solution [2]. Hejmady et al. observed the microstructural evaluation during selective laser sintering of polyamide 12 (PA12) particle doublets by in-situ synchrotron wide-angle X-ray diffraction (XAXD) using their selfdeveloped laser sintering system. At the same time, they recorded the neck growth between the particles and the temperature using optical and infrared microscopy. They concluded that isothermal crystallization experiments under quiescent conditions are not sufficient to describe crystallization in a non-isothermal process such as SLS.
They showed that both optical and atomic force microscopy reveals significant differences in the crystalline structure of the laser-influenced region compared to the non-influenced region [3]. Griessbach et al. [4] provide an overview of the advantages of the SLS process in achieving suitable mechanical properties of workpieces made of PA-based materials and formulate some recommendations and guidelines for improving the process. Stichel et al. [5] performed mechanical tensile tests and analyzed the microstructure of different sample batches produced with different machines. The pore morphology was measured using X-ray computed tomography and discussed concerning the applied parameters and the mechanical properties achieved. The authors concluded that pore density is an important indicator of porosity in terms of mechanical behavior. This is especially true along the build direction where anisotropy occurs significantly. They also found that the pore density is influenced by the process temperature. Cobian et al. investigated the mechanical behavior of test specimens produced by the SLS process using PA12 material in a wide range of strain rates and different print orientations. The compression objects were characterized by macroscopic tests on bulk samples and compared with nanoindentations performed directly on the surface of the lattice material. The authors found an excellent correlation between the rate-dependent mechanical properties determined at both scales, validating microscopic methods for characterizing the mechanical response of SLSfabricated PA12 samples [6]. Klippstein et al. investigated the influence of the shelf life of PA12 powder on the mechanical properties with the help of characterizations carried out.
They conducted studies with two different batches of PA12 powder, one of which was 55 years old and the other 65 years old, and compared them with the reference batch, which was 0,5 years old. They analyzed the powder and performed a mechanical characterization of the samples produced. They found that the mechanical properties of the tested batches did not differ significantly from those of the reference batch. The color of the objects produced with the two oldest powders is rather yellowish. They concluded that the reason for this phenomenon is due to the consumption of polyamide stabilizers, as it can be assumed that these parts are subject to significantly faster aging [7]. Krönert et al. conducted a study with PA12 in which different orientations of test specimens according to DIN EN ISO 527-2 type 1A were characterized about basic mechanical properties, more precisely quasi-static tensile tests, creep tests under different loads. The test specimens were positioned in the building platform in the directions 0°, 15°, 45° and 90°.
In addition, elastic strain, relaxation strain, viscous strain and total deformation were determined. The results show that short-term creep and relaxation tests indicate that the elastic and viscous strain is only slightly affected by the installation direction. The authors found that the viscoelastic strain is influenced by the direction of construction and the deformation due to creep and relaxation has no significant effect on the mechanical behavior as shown by the tensile tests [8]. Kadkhodaei et al. investigated the elastic behavior of standard test specimens produced with different orientations using PA2200 powder. The elastic response was investigated under uniaxial tension at different strain rates of the test samples. The authors proposed hyperelastic Mooney- Rivlin models to describe the behaviour of the nonlinear elasticity of the samples. The results of the cyclic response of the samples show that a rate-dependent hyperelastic constitutive model exists for samples produced by the SLS technique. This model was validated by comparing the numerical prediction with the empirical results from the tensile tests [9]. Aldahash fabricated test samples from PA12 powder considering different buildup directions to investigate the tribological properties of PA12 samples.
The study focused on the dry sliding friction and wear properties of the PA12 samples. Pin-on-disc tests were conducted, in which PA12 pins pressed against a stainless-steel disc were observed under prescribed conditions. The results have shown that the friction coefficient, frictional heat, and specific wear rate of PA12 samples aligned along the Y-axis are significantly lower compared to samples aligned along the X- and Z-axes. The author found that abrasive wear, adhesive wear, and, in some cases, fatigue wear occurred at the steady-state wear stage on the PA12 specimens oriented along the X and Z directions [10].
The novelty of the research work presented is to precisely determine the effects of the different orientations on the comprehensively defined mechanical properties of the test specimens, which is required as technological knowledge for the corresponding material and design optimization of the parts produced with the selective laser sintering technique.
Material and Testing Methods
Material and Specimen Geometry
The material used for the 3D production in the selective laser sintering process was the polymer material polyamide 12 with the trade name Dura Form PA12 from the manufacturer 3D Systems. The PA12 material is suitable to produce functional prototypes and inserts for rapid tool production. The main advantage of the material is its excellent resistance to grease, oil, water, salt solutions, etc. The material has good stress and crack resistance as well as good damping of noise and vibrations [11]. Components made from PA12 can be found in many different applications such as prototyping parts, the automotive industry, medical devices, piping, fittings, etc. The observed test specimen was determined according to the EN ISO 527-2 Type 1BA standard [12].
Selective Laser Sintering (SLS)
Selective laser sintering was developed several decades ago, more precisely in the late 1980s at the College of Texas at Austin, and later commercialized in the early 1990s. It is a layer-based process in which the 3D object is built using a laser beam that selectively passes over a predefined area on the powder layer shown in Figure 1. The process repeats cyclically, the laser beam melts the powder, it can initiate the crystallization of the polymer structure that binds the material together into a solid structure, and when the next layer of colder powder is applied, it builds up to the geometry of the final product.
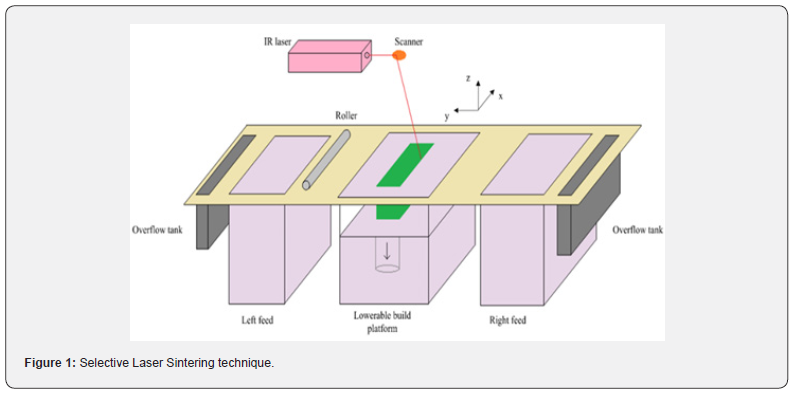
At the start of 3D printing with this technique, all key components of the machine must be heated to the prescribed temperatures, e.g. the part bed, the left and right feed, the laser window, the part cylinder and the part piston. The task of the heating elements is to heat the powder to a temperature just below its melting point. To cool down the sintering process, a cooling system must be switched on to supply O2. The pre-stage process lasts until the optimum temperature is reached. As soon as the component bed is lowered by a tenth of a millimeter, a roller begins to apply the powder layer to the bed surface. In the next phase, a laser beam scans the 2D shape of a single layer of the component using a lens-mirror system. After each layer has been scanned, the component bed is lowered by another layer and the process begins to finish the product.
The process enables the production of complex 3D shapes in the form of design models or prototypes and uses different types of polymer materials, such as general polyamides 12, as well as polymer materials reinforced with glass or carbon fibers. One advantage of the technology is that the parts produced do not require any support structures. The process has great future potential in the field of development for rapid prototyping of products and consequently contributes to a shortened development time until the final parts or products are launched on the market. The technology for manufacturing rapid tooling systems is particularly useful in the production of products in small batches. It is clear that demolding angles and undercuts are not a problem with this production process (Figure 1).
Mechanical Characterizations
Charpy Impact Test
The notched impact strength and the overall notched impact strength of materials are closely linked. The impact strength test therefore receives a great deal of attention from official standardization bodies as well as from manufacturers and end users. The definition of impact strength is the amount of energy per unit volume required to break the sample. Two common methods are used to evaluate the impact strength of polymer materials: the pendulum impact test and the drop weight test. The samples can be notched or in bulk. Notches reduce the impact strength of a material due to the stress concentration. The notch sensitivity of different materials varies greatly. When testing the notched impact strength of polymers, it’s essential to consider the temperature, viscoelasticity, and loading speed, as the materials react more brittle on faster impact.
The Charpy impact test is one of the most used test methods to determine the fatigue performance of specimens according to the prescribed ISO standard, which was used in this research [13]. The Charpy impact strength measurements were carried out according to ISO 179 [14] using a LIYI LY-XJJD5 pendulum impact tester. The dimensions of the test specimen were 80 mm x 10 mm x 4 mm. The distance between the supports was 60 mm. The pendulum has an impact velocity of 2.9 m/s with an energy of 2 J for unnotched specimens and 1 J for notched specimens. The results of the Charpy impact test are either the Charpy impact strength (unnotched) or the Charpy impact strength (notched), both given in kJ/m2.
Tensile tests
Mechanical properties play an important role in many technical cases. The tensile test is one of the most common methods for determining the suitability of a material for a specific application. During the test, the specimen is subjected to a uniaxial tensile force, which causes the specimen to deform. Force and displacement are measured quantities that are usually converted to obtain a stress-strain curve [16]. The following quantities were measured according to the standard:
i. Tensile strength is defined as the first maximum of the stress-strain curve,
ii. Elongation at tensile strength is defined as the first maximum of the stress-strain curve and
iii. Elongation at break is defined as the last recorded data point before failure of the specimen.
The tensile tests were carried out under the ISO 527-1 standard [16] on the Shimadzu AG - X plus testing machine, equipped with a 10 kN load cell. As already mentioned, the specimens were prepared according to ISO 527-2 (type BA) [12]. The tensile tests were carried out at a crosshead velocity of 1 mm/ min up to an elongation of 0.25 % and then at 50 mm/min until failure. The strain was measured at the center of the span of each specimen using a Shimadzu TRViewX optical extensometer. The measuring length was 20 mm and the clamping distance was 50 mm. The TrapeziumX software (version 1.3.1) was used to process and evaluate the results [17].
Flexural tests
In many cases, mechanical components are subjected to bending in practice. The test specimen is usually placed on two support pins, while the third pin applies a force in the center of the test specimen. The applied force and displacement are measured to derive the stress-strain curve of the observed material properties [13]. In this research work, the bending test according to ISO 178 consists of the following variables:
i. Flexural strength - maximum stress applied to the specimen during the bending test and
ii. Bending strain at flexural strength - elongation at flexural strength.
The bending tests were carried out according to the ISO 178 [18] standard on a Shimadzu AG - X plus universal machine with a 10 kN load cell. The manufactured test specimens had standardized dimensions (80 mm x 10 mm x 4 mm). The distance between the supports was 64 mm. The tests were carried out at a crosshead speed of 2 mm/min. The TrapeziumX software, version 1.3.1, was used to evaluate the test results [17].
Design of Experiments
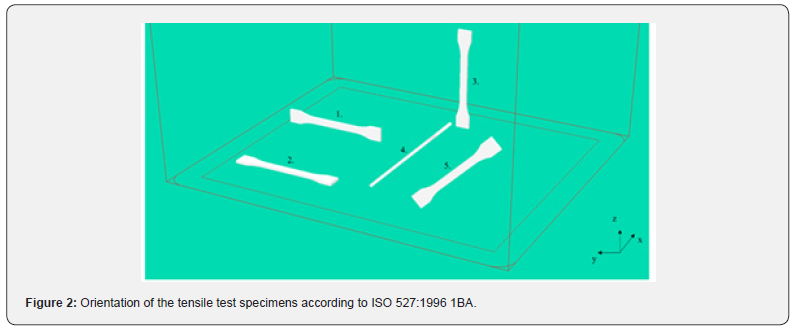
SLS sPro 60 machine was used to carry out two basic studies. In the first study, the effects of basic input parameters such as laser power and scan distance on the impact, tensile and flexural properties. of PA12 powder were investigated and evaluated. The test specimen was manufactured according to ISO 527:2012. Figure 1 shows different investigated orientations of the specimen.
Standardized Charpy tests with and without notch according to ISO 179:2010 were conducted to evaluate the notched impact strength. In the first test, the effects of laser power and scan distance were correlated with the mechanical properties of tensile strength and notched impact strength. The aim of selecting the technological input parameters was determined based on previous experience and 3D Systems’ supplier guidelines. Alignment number 2 was set to investigate the material properties for the most positioned parts during 3D manufacturing. In the research phase, the effects of different orientations on the mechanical properties of the test specimens were investigated. Table 1 shows the basic input properties of the process at orientation number 2. Figure 2 shows different orientations of the test specimens. Orientation 1 was oriented 90 degrees from the z-axis to orientation 2. Orientation 3 was oriented 90 degrees to orientation 1. Orientation 5 was aligned 45 degrees along the y-axis to orientation 3. Orientation 4 was aligned 90 degrees along the x-axis to orientation 5.

Based on the results obtained for the mechanical properties and impact strength of the specimens produced by the SLS process using PA12 powder, the most suitable combination of input process parameters/designation of the specimen was selected for further investigation to determine the effects of each orientation on the material properties. The main criterion for selecting the input combination of process parameters is to achieve the highest tensile and notched impact strength properties of the specimens. The temperature of the 3D manufacturing process was set at 177°C. Each specimen produced with the selected process parameters was given a specific name. Ten specimens were produced with the same input parameters. The diameter of the laser beam was approximately 0.45 mm.
Presentation of the Results
Impact of the Process Parameters
Figures 3, 4, 5 & 6 show the results of the mechanical characterizations carried out as part of the research work. The columns show the average values for each mechanical property measured, calculated considering 10 replicates for each mechanical parameter. For each calculated average value for the selected mechanical property, the standard deviation interval is indicated in each column.
Figure 3 shows the measured values for the notched impact strength of samples obtained using two different test methods. The grey column shows the results obtained with the Charpy standard test on unnotched samples. The yellow column shows the results of the Charpy test with a notch on the samples. Significantly, samples 0245_05 and 0245_6 express the highest impact strength. Concerning Table 1, this means that the notched impact strength is significantly influenced by the scan distance.
Figure 4 shows the measured values for the tensile properties, in particular the maximum tensile stress column and the tensile stress at the break of the PA12 standard specimen. From Figure 4 it is not possible to precisely determine the correlation between the laser power, the scan distance, and the measured mechanical properties. The explained correlation is shown in the following description of the regression model created in Mini Tab and a corresponding analysis of variance is presented later in the chapter. The results show a trend towards better mechanical tensile stress (maximum and at break) for samples 0245_5 and 0245_6.
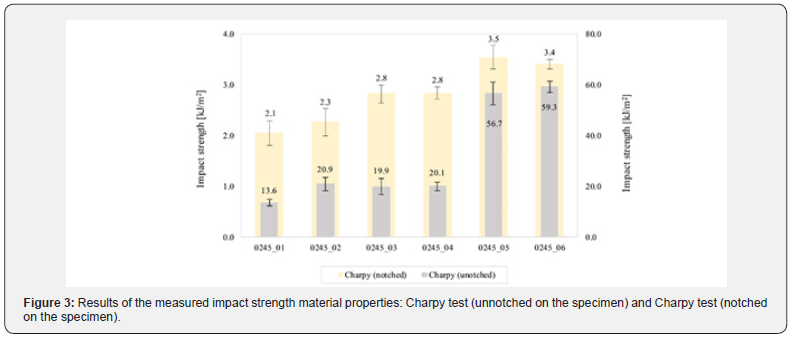
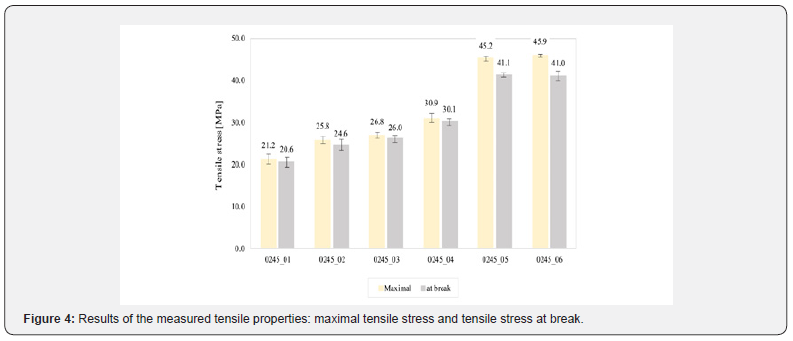
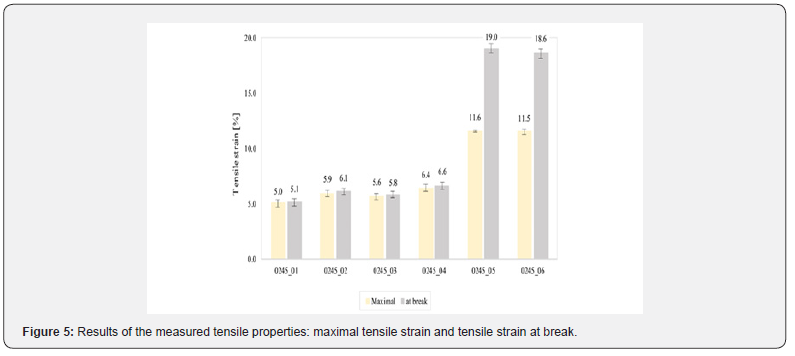
Figure 5 shows the measurements of the maximum tensile elongation and the tensile elongation at the break of the standard PA12 specimen. The correlation between Figure 3 and Figure 5 exists when the column height trends are compared. It indicates a possible correlation between the material properties of impact strength and elongation. The results show a significant, directly proportional correlation between the maximum strain and the elongation at break and the input process parameter scan distance, which defines the distance between two consecutive laser beams. It is known that a reduction in the scan distance leads to poorer packing of the powder particles or unsintered particles, which in turn results in lower deformation properties and elongation of the samples. Gibson and Shi [19] also explained a similar downward trend in scan distance when studying the density of samples made from polymers. This means that a larger scan distance leads to a lower density and hardness.
Figure 6 shows the measurements of the elastic bending strain on the first y-axis and the maximum bending stress on the second y-axis of the standard PA12 specimen. Here, too, the measurements on samples 0245_5 and 0245_6 stand out, as they exhibit both the highest bending strain and the highest bending stress on the second y-axis. Similar trends in the magnitude of the bending properties for individual specimens can be seen as in Figure 4, which describes the tensile measurements of the specimens.
Sample number 0245_6 was selected for further research observations and investigation to determine the influence of orientation on mechanical properties. The selection was based on the measured maximum toughness and strength properties of the measured specimens, especially in Charpy tests (unnotched) and the maximum stress σRM. The aim was to determine a material with the best ratio between strength and impact strength.
Regression Model
To determine the relationship between the input process parameters and the mechanical properties of the PA12 material, a regression analysis was performed using Minitab software. Table 2 shows the significant linear regression parameters. The data were processed using a statistical test. Analysis of variance, also known as ANOVA, is used to show differences in the means of at least three groups. Factor main effects and factor interaction models provide a useful tool for examining the underlying structure of the data when the groups in a one-way ANOVA have been identified as combinations of two or more factors. The interpretation of the two-way ANOVA model with main effects alone is examined as well as the difference with the interaction model. The discussion focuses on three-factor models and their interpretations by fitting sequences of progressively smaller models, where appropriate models can be found by applying generalized testing procedures to find models that fit well within each sequence. Generalized linear models can also benefit from ANOVA models, which are explained with examples of logistic regression. p-value: The variable is statistically significant if its p-value is equal to 0.000. If the p-value exceeds the typical significance level of 005, it is not statistically significant [20]. R2 is the percentage of variation in the response that is explained by the model. It is calculated as 1 minus the ratio of the total sum of squares (which represents the total variation in the model) to the error sum of squares (which represents the variation not explained by the model).
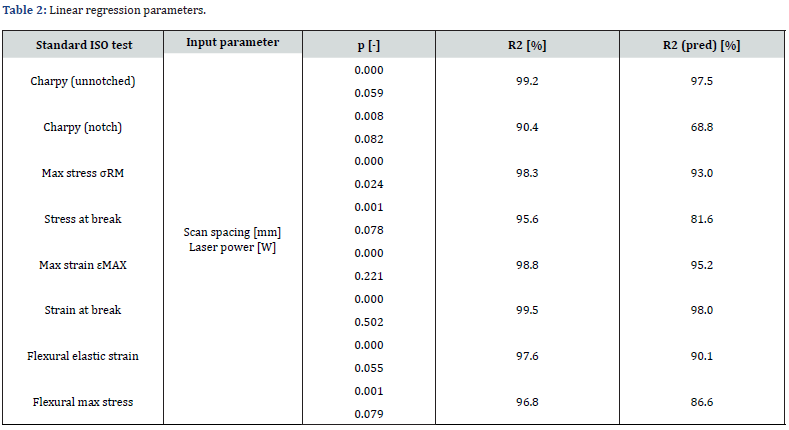
The better the model fits the data, the greater the R2 number, which is always between 0% and 100%. R2(pred) is calculated with a formula that corresponds to a systematic removal of each observation from the data set and an estimate of the regression equation. and determines how well the model predicts the removed observation. The value of the predicted R2 is between 0 % and 100 %. Predicted R2 to determine how well your model predicts the response for new observations. Models with larger predicted R2 values have better predictive ability. If the predicted R2 is significantly lower than R2, the model is “overfitting”. Overfitted models occur when you include terms for effects in the model that are not relevant to the population. The model is “fitted” to the sample data and may not be suitable for making predictions about a population. Also, when comparing models, the predicted R2 is more useful than the fitted R2 because it is based on observations that are not included in the model calculation.
Figure 7 shows factorial diagrams of the test results obtained with the Charpy standard test (unnotched) as a function of the laser power on the left-hand side and on the right-hand side as a function of the scan distance. The model was fitted using experimental data with 99 % in the interval from 17 to 20 W for the laser power and from 0.15 to 0.30 mm for the scan distance. A significant difference was found between the two fitted mean lines, especially in terms of slope. When looking at the fitted mean lines for scan distance compared to the fitted mean lines for laser power, a significant slope is observed. This is confirmed by the p-value, which is 0, in contrast to the laser power with p = 0.059.
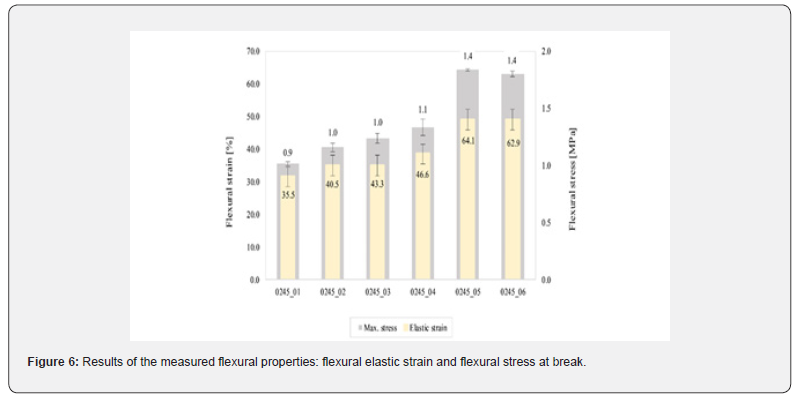
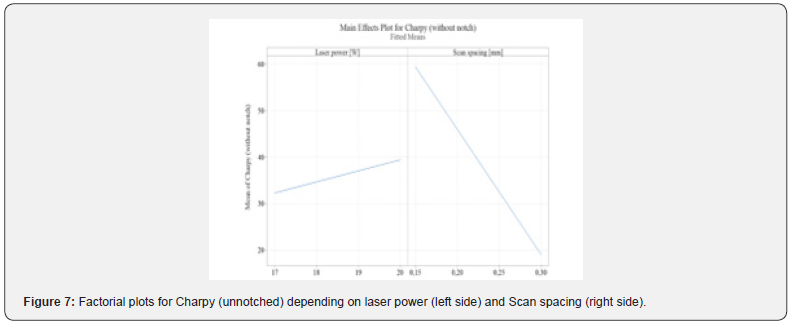
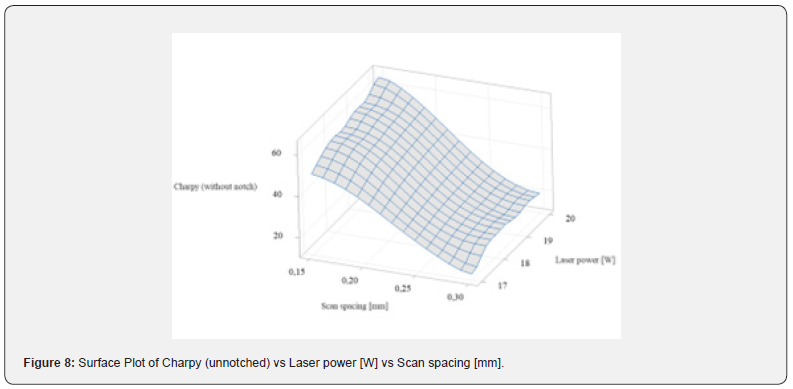
Figure 8 shows a surface plot for the observed dependence between laser power and scan distance in correlation with the measured output obtained by the Charpy test, where the samples were tested without notch at a temperature of 177°C. When considering the influence of the scan distance, a significant influence of the mentioned process parameter on the notched impact strength of the material can be determined. The impact strength changes gradually with decreasing scan distance, which indicates good packing of the powder particles. The distribution has a slightly lower dependence on the scan distance at its ends. This means that the maximum notched impact strength of the material is achieved at a scan distance of 0.15 mm and a laser power of 19 W./
Build Orientations
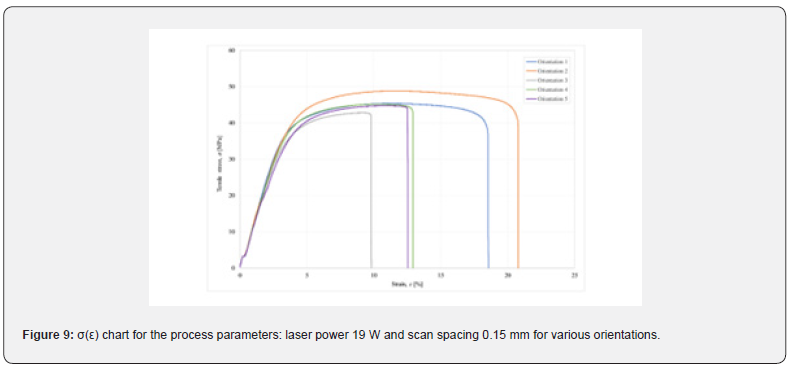
In this section, the effect of different orientations of the manufactured test specimens was determined and analyzed with the combination of process parameters under the number 0245_06, which was irradiated with a laser power of 19 W and a scan distance of 0.15 mm. Figure 9 shows an example of the results for one of ten tests carried out for each orientation of sample production. Figure 9 shows that orientation 2 has the greatest influence on the highest tensile stress at the break of the 3D fabricated sample. For the specimen with orientation 2, the fabrication process was performed in orthogonal orientation according to the force applied in the uniaxial tensile test. The lowest tensile stress at fracture is achieved in the specimen with orientation 3, in which the force was applied perpendicular to the structural layers in the uniaxial test, which corresponds to the physical process.
Table 3 shows the results of the mechanical characterization of sample 0245_06, considering different sample orientations. Table 3 shows the average value for all observed mechanical parameters. The calculated standard deviations for each mechanical parameter are given in brackets.
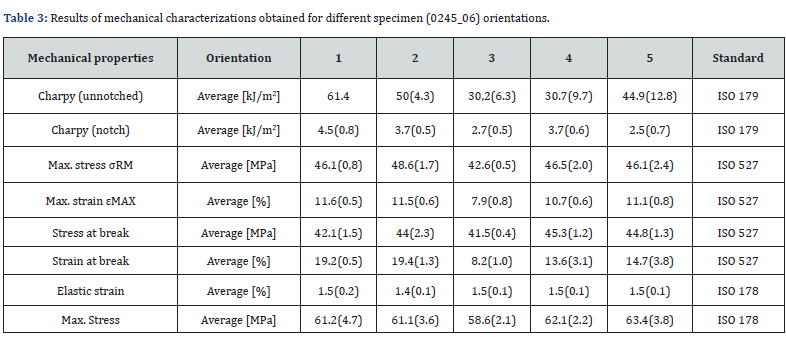
The same mechanical properties were characterized on the selected sample with the designation 0245_06 as already described in the previous section. In this section, the detailed effects of the five different orientations (see Figure 2) are examined and discussed. Ten samples were measured for each orientation. Based on the results, a method was developed to determine the mutual influence of each orientation on the observed mechanical properties.
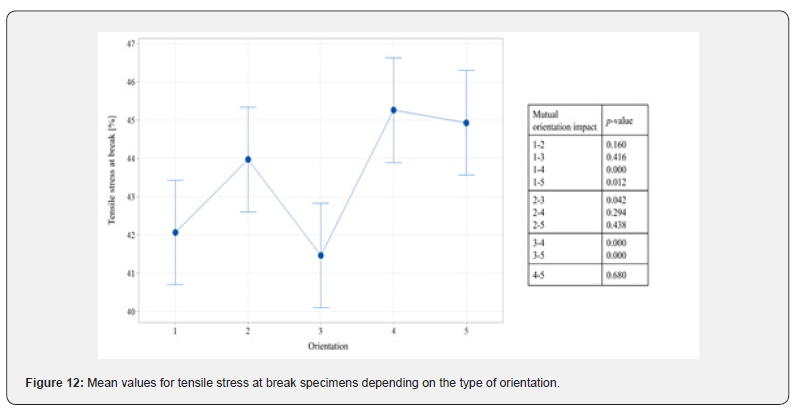
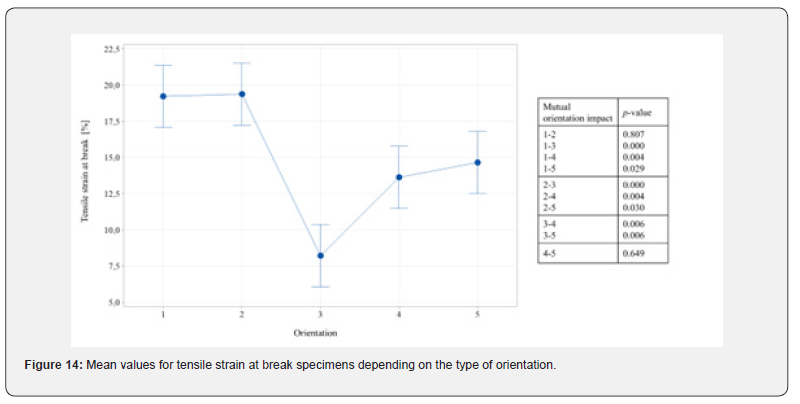
The analysis was based on determining the influence of all orientations on a single mechanical parameter. Due to the amount of experimental data obtained, the influence of the orientation that has the greatest influence on the stated parameter is shown below. In each of the following figures, the orientations are shown on the x-axis as a function of the averaged mechanical parameter shown on the y-axis. To determine the influence of orientation on a mechanical variable, a one-way ANOVA was analyzed with a null hypothesis that all means are equal, with the significance level set at α = 0.05. This means that it can be asserted with a probability of 95% that the stated interval surrounds the calculated mean for the given orientation. To assess whether the values are the same in terms of orientation, a p-value was specified. For the notched impact strength properties determined by the (unnotched) Charpy test, the influence of the orientations on the notched impact strength could not be determined, as the samples oriented with 1 and 2 are not fractured.
Figure 10 shows the calculated average values of the Charpy tests as a function of orientation. The mutual influence of the two orientations is shown on the left-hand side of Figure 10. Statistically, it can be confirmed that the result with orientation 1 is completely different compared to the results of the other four different orientations when considering the null hypothesis, as evidenced by the p-value given in the first row of the table in Figure 10. Looking at the effects of orientation 2 on the other orientations, it can be seen that orientations 2 and 4 have the same values with a probability of over 90%. The other orientations differ from orientation 2 as far as the null hypothesis is concerned. The null hypothesis can also be rejected in the case of a comparison between orientations 3 and 5, as the p-value is 0.307 and is greater than 0.05.
Figure 11 shows that the effects on the maximum tensile stress of the samples are the same when considering orientations numbered 1, 4, and 5, as evidenced by the p-value of more than 0.05. It can be seen that orientation 2 has the greater influence on the maximum tensile stress of the specimens, in contrast to the evaluation of the influence of the orientations on the Charpy notched impact strength, which is achieved at orientation 1, where the specimen is positioned 90 degrees to the most natural position of orientation 2. The lowest measured maximum tensile stress occurred in the specimens oriented with orientation 3. The fabrication process of the specimens with orientation 3 was performed perpendicular to the function of force in the uniaxial tensile test, which is as expected.
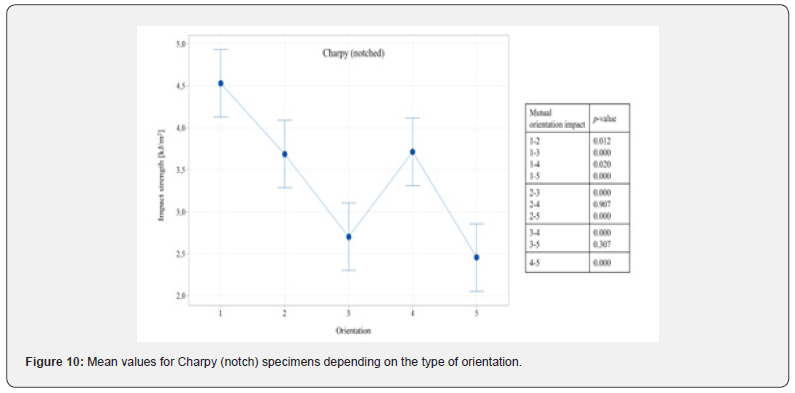
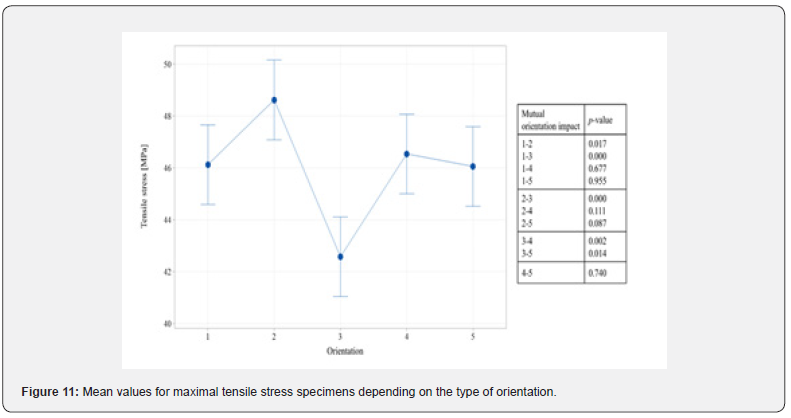
Figure 12 shows the tensile stress generated at the break in the various test specimens with different orientations. Comparing the influence of the orientations, it can be seen that orientations 1 and 3 have the same influence as orientations 2, 4, and 5. The trend of the generated stress at the break for the listed orientations is similar compared to the maximum tensile stress. In the previous Figure 11, the maximum tensile stress is generated for the specimens positioned with orientation 2, in contrast to the value for the resulting stress at fracture for orientation 2. The statistical analysis shows that orientation 2 has the same effect compared to orientations 4 and 5.
Figure 13 shows the maximum elongation of the specimens, expressed in %, at the specified orientations. Orientations 1, 2, and 5 are statistically supported by the p-values based on the probability mean. Orientation 3 proved to be less favorable with regard to the lowest elongation of the samples. For the other mean values, it is shown that they lie within the defined interval limits with a probability of 95 %, which means that they are the same or slightly close to each other, which defines an insignificant influence between the other four orientations in the measurements of the elongations of the samples.
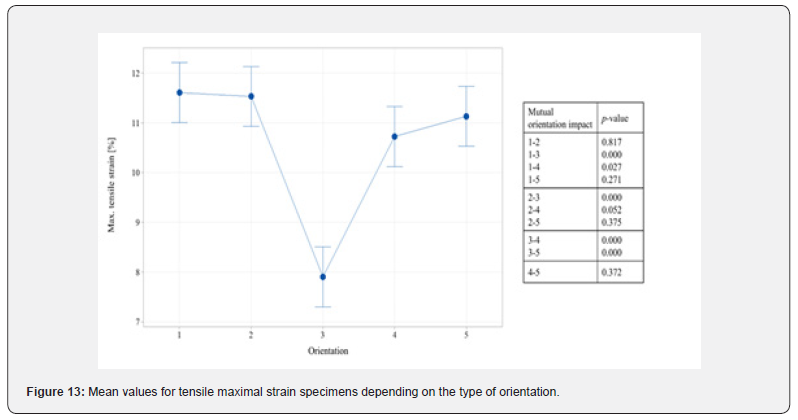
The mean values shown for the elongation at break for the test specimens show a similar trend to the trends shown in Figure 13, which were evaluated for the maximum elongation of the test specimens. In both cases of mean value distribution as a function of orientation, shown in Figure 13 and Figure 14, the orientations labeled 1 and 2 deviate significantly with respect to the higher strains of the specimens. This is also confirmed by the mean values for Charpy notched impact strength, which is highest for the samples produced with orientations 1 and 2, indicating the greater material resistance under fatigue loading.
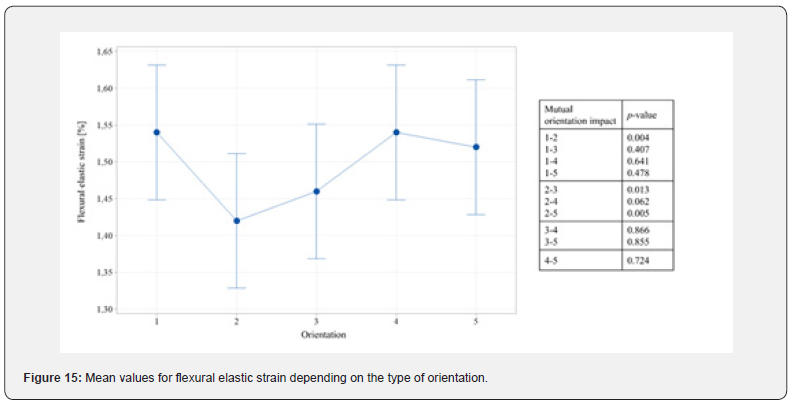
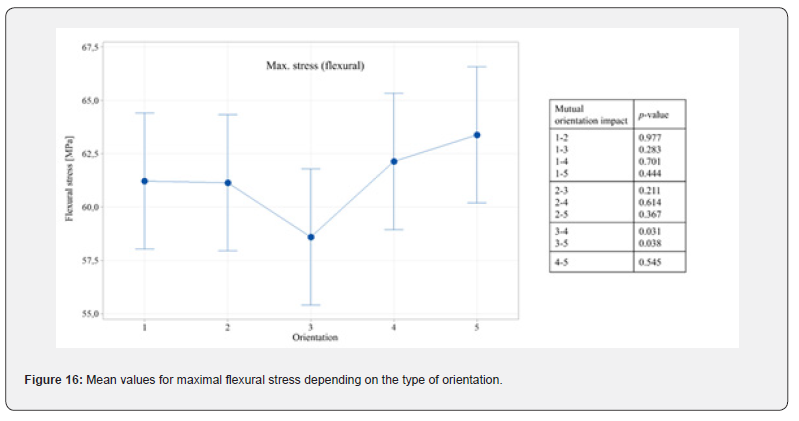
Figure 15 shows the mean values for the bending elastic strain as a function of the different orientations. Figure 15 also shows the corresponding mean values for the maximum bending stress as a function of the selected orientations (Figure 16). Looking at the effects of the different orientations on the bending elastic strain shown in Figure 15, it is noticeable that most of the mean values fall in the predicted intervals where there is statistically no difference between them. Looking at the trend shown in Figure 15 and Figure 16, it can be seen that the amplitude of the bending stress is inversely proportional to the bending elastic strain, which can possibly be related to the thesis that the strength is inversely proportional to the impact strength of the material.
Discussion
Selective laser sintering is a specific additive manufacturing process that can be used to produce components of all kinds, in particular components with medium to large dimensions, more precisely up to around 500 mm, and thin walls up to around 0.7 mm. The process makes it possible to manufacture products with narrow specified dimensional and geometric tolerances, which are generally also characterized by corresponding dimensional stability due to the precise process, which enables a uniform polymer structure of the component over the entire cross-section.
The scientific work describes and determines the influence of the two most important process parameters, such as laser power and scanning distance, on the basic mechanical properties obtained according to ISO standards of standard test specimens made of the commercially available material PA12, called Dura form. Based on the best mechanical properties obtained for the test specimens, the combination of process parameters was applied to specimens produced with different orientations. Regarding the influence of the laser power and the scan distance, the results showed that the scan distance has a greater influence on the mechanical properties, such as the impact strength as well as the tensile and bending properties of the material. In particular, the test specimens produced with a scan distance of 0.15 mm withstood higher mechanical loads than the specimens with a scan distance of 0.30 mm. Two specimens achieved the highest mechanical properties at a scan distance of 0.15 mm. It is difficult to distinguish between the results of the two specimens as to which proves to be more promising in terms of transferring mechanical properties, as the differences are within the measured standard deviations of the replicates. The reason for the better mechanical resistance of the test specimens produced with a smaller scan distance is a more efficient manufacturing process in terms of good packing of the particles.
Based on the measured mechanical properties of the samples that withstand the highest loads, the influence of the different manufacturing orientations was investigated. The results showed that the orientation of the test specimens parallel to the building platform (Figure 2: orientation 2 - planar) and rotated by 90 degrees (orientation 1 - edge) compared to the first orientation have given the highest impact strength mean values as well as higher elongations of the samples which describe to the maximum toughness of the samples.
In general, orientations 4 and 5, aligned at 45 degrees to the build platform, were found to have statistically the same influence on all measured mechanical properties. Looking at the bending properties, orientations 1, 2, 4, and 5 have statistically the same influence. Orientation number 2 showed the lowest mechanical resistance of the test type, which is consistent with the physics of material mechanics, as the sintering process of the material took place in the direction of the uniaxial force effect during the tensile test, in contrast to the bending test, where this correlation is not meaningful.
The presented research has a suitable basis from the point of view of the acquired technological guidelines of SLS processing. Future research will be based on the implementation of the acquired technological parameters and the knowledge of the influence of the orientations on the mechanical properties using the example of the production of real mechanical components. The different sets of parameters and orientations will be used in component processing depending on the considered loading regime that occurs during the operation of the mechanical component. In this way, the designed technological concept of the guidelines presented in the thesis will be confirmed and validated.
Declarations
Conflict of Interest: The authors declare that they have no known competing financial interests or personal relationships that could have appeared to influence the work reported in this paper.
Credit Author Statement
Matija Hriberšek: Formal Analysis, Writing - Original Draft, Visualization, Writing - Review & Editing, Data Curation. Rebeka Lorber: Conceptualization, Investigation. Blaž Nardin: Conceptualization, Methodology, Writing - Review & Editing.
References
- Brighenti R, Cosma MP, Marsavina L, Spagnoli LA, Terzano M (2021) Laser-based additively manufactured polymers: a review on processes and mechanical models. J Mater Sci 56: 961-998.
- Hupfeld T, Laumer T, Stichel T, Schuffenhauer T, Heberle J, et al. (2018) A new approach to coat PA12 powders with laser-generated nanoparticles for selective laser sintering. in: Procedia CIRP 74: 244-248.
- Hejmady P, van Breemen LCA, Hermida-Merino D, Anderson PD, Cardinaels R (2022) Laser sintering of PA12 particles studied by in-situ optical. thermal and X-ray characterization. Addit Manuf 52: 102624.
- Griessbach S, Lach R (2008) Small Series Production of High-Strength Plastic Parts. Kunstoffe International 5: 29-32.
- Stichel T, Frick T, Laumer T, Tenner F, Hausotte T, et al. (2018) Round Robin study for selective laser sintering of polymers: Back tracing of the pore morphology to the process parameters. J Mater Process Technol 252: 537-545.
- Cobian L, Rueda-Ruiz M, Fernandez-BJP, Martinez V, Galvez F, Karayagiz F, et al. (2022) Micromechanical characterization of the material response in a PA12-SLS fabricated lattice structure and its correlation with bulk behavior. Polym Test 110: 107556.
- Klippstein SH, Kletetzka I, Sural I, Schmid HJ (2023) Influence of a prolonged shelf time on PA12 laser sintering powder and resulting part properties. Int J of Adv Manuf Technol 126: 2147-2157.
- Krönert M, Schuster TJ, Zimmer F, Holtmannspötter J (2022) Creep behavior of polyamide 12. produced by selective laser sintering with different build orientations. Int J of Advanced Manuf Technol 121: 3285-3294.
- Kadkhodaei M, Pawlikowski M, Drobnicki R, Domański J (2023) Modeling of hyperelasticity in polyamide 12 produced by selective laser sintering. Cont Mech and Thermo 35: 1735-1744.
- Aldahash AS (2021) Friction and wear properties of oriented Polyamide 12 objects manufactured by SLS Technology. J Eng and App Sc 8 28–36.
- (2024) 3D Systems, Duraform PA.
- (1996) Determination of tensile properties of plastics: Test conditions for moulding and extrusion plastics.
- Grum J (2006) Book Review: Handbook of Polymer Testing Short-Term Mechanical Tests 27(3): 293.
- (2023) Plastics: Determination of Charpy impact properties, Part 1: Non-instrumented impact test.
- Grellmann W, Seidler S (2013) Polymer Testing 2nd edition, Hanser Publications, Munich.
- (2019) Plastics: Determination of tensile properties, Part 1: General principles.
- (2024) Shimadzu, Trapezium X software.
- (2019) Plastics, Determination of flexural properties.
- Gibson I, Shi D (1997) Material properties and fabrication parameters in selective laser sintering process. Rap Prot J 3: 129-136.
- What are t-values and p-values in Statistics (2024) Minitab: statistics and quality data analysis.


