


Laboratory Investigation of Rheological Properties of Polymer and Crude Oil
Clifford Tamuno-Ibime Dexterity*
Department of Petroleum Engineering, Rivers state University, Nigeria
Submission: July 29, 2017, Published: September 12, 2017
*Corresponding author: Clifford Tamuno-Ibime Dexterity, Department of Petroleum Engineering, Rivers state University, Port Harcourt, Nigeria, Email: dexterityclifford@gmail.com
How to cite this article: Clifford T. Laboratory Investigation of Rheological Properties of Polymer and Crude Oil. Recent Adv Petrochem Sci. 2017; 2(5): 555600. DOI:10.19080/RAPSCI.2017.02.555600
Abstract
By analyzing the rheological properties of polymer and crude oil, it was found that polymer action on different crude samples vary with respect to fluid type. Fluid resistance to flow decreased after 0.01Molar Concentration of polymer (Xanthan gum) was used to form a buffer solution with 500mls of water kept for a period of 7days. 400mls of the buffer solution formed with Xanthan gum + 200mls of each crude oil sample were used to make an investigation of the rheological properties of the polymer and crude oil. The Rheology of the crude samples, buffer solution and the crude oil samples + buffer solution were recorded at a constant temperature of 250C was also taken.The growth of microbes was discovered after 7days this microbes further reduced the resistant to fluid flow by breaking the heavy hydrocarbon molecules, compared to their initial viscosities. The viscosity of fluid flow was monitored via shear stresses in relation to different shear rates using the Power Law Model which graphically interprets how the fluid responds to shear thinning, monitored at different revolutions per minute (rpm) was discovered to give best response at a high shear rate of 600rpm.The investigation of the fluid flow was done by modeling a simulated reservoir using sandstone tube from Darcy's equation for fluid diffusivity which confirms that a decrease in viscosity causes an increase in the flow rate with the assumption made that fluid flow rate equals production rate. The xanthan gum polymer is preferably used because it is cost effective and environmentally friendly.
Keywords: Xanthan gum; Viscosity; Shear thinning; Microbes; Flow rate
Introduction
Rheology gives a proper knowledge of fluid flow behaviors. It is generally, the study of how matter deforms and flows, including its elasticity, plasticity and viscosity. In geology, rheology is particularly important in studies of moving ice, water, salt and magma, as well as in studies of deforming rocks. Rheological modeling of fluids in the field is visually described by the Bingham plastic or the power law model. Although this model is fairly easy to solve for its specific descriptive parameters, they do not simulate fluid behavior across the entire rheological spectrum very well, particularly in the low shear rate range [1].
The following definitions help in understanding this model:
• Shear rate (y) in a simple flow is the change in fluid velocity divided by the gap or width of the channel through which fluid is moving.
• Shear stress (t) is the force per unit area required to move a fluid at a given shear rate.
• Fluid viscosity (|i) is the fluid's shear stress divided by the corresponding shear rate
•The power law Model (PL) characterizes mud behavior across the entire shear rate range.
Plastic viscosity (PV)

Plastic Viscosity (PV) is a resistance of fluid to flow. According to the Bingham plastic model, the PV is the slope of shear stress and shear rate (Figure 1). (Drilling formulas: Viscosity of drilling mud) [2]. Typically, the viscometer is utilized to measure shear rates at 600, 300, 200, 100, 6, and 3 revolutions per minute (rpm). With increased use of polymer- based fluids in the oil field, the power law (PL) model became popular because it fits the behavior of these fluids better than the Bingham plastic model. The model's relationship between shear stress and shear rate is given by
Shear stress = K x (shear rate)n

The two key terms in the PL model are the consistency index (K) and the fluid flow index (n). Although the model fairly accurately predicts fluid behavior at the higher shear rates, it fails across the lower shear rate range (0-100rpm). Moreover, people who use the PL model recognize that different values of n are possible, depending on which particular shear stress/ shear rate pairs are used in the calculation methods. n and K can be calculated from any two value of shear rate and shear stress. The method of reading shear rate on the rig comes from a V-G meter (Figure 2). Typically, 600rpm, 300rpm and 3rpm are obtained from every fluid rheology test and we can use those reading to determine n and K. The following equations are used to get the Power law constants (n and K).
Shear stress = K x (shear rate)n
Where;
n = 3.23 Log (0 600/0 300)
K = 5.11 (Reading at 300/511n)
n is the power law exponent. (Flow behavior index) dimensionless
K = consistency factor, (poise)
θ300 = reading at 300rpm
θ600 = reading at 600rpm
A graph of shear stress against shear rate was plotted to consider the rate of flow which explains the Power Law Model better was aided by the Darcy's equation for an unsteady state process. The most commonly used fluid model to determine the rheology of non-Newtonian fluid is the Bingham plastic model. With this model, it makes the assumption that the shear rate is a straight line function of the shear stress. The point where the shear rate is zero is called "Yield Point” or threshold stress. (Drilling fluid formulas: types of flow and rheology models) [3].
Darcy equation in petroleum engineering
The Darcy Equation in fluid diffusivity for an unsteady state process is introduced to predict fluid flow showing how flow rate varies inversely with viscosity. Also, a simulated reservoir sytem was modelled to note the conditions through which the fluid flows and their various viscosities recorded.
Q = (-KA )/μ dP/dx
The Darcy Equation was introduced to note the resistance to flow of the fluid samples (crude oil + a buffer solution made with xanthan gum) through permeable media. This was done in a one dimensional, homogenous rock formation (sandstone) for an unsteady state process.
Assuming flow rate = Production rate
qsc = ((KA )/(μBΔx2 ))x Pi-1 - 2Pi + Pi+1
q = λ1ΔPi
The equation was further derived showing how flow rate varies with viscosity.
Materials and Method
Crude oil samples
3 Different Niger Delta Crude oil samples were obtained and worked on.
1. SAMPLE A - AGBDZ (0375) from Agbada Field.
2. SAMPLE B -IMOR- E (5133)
3. SAMPLE C - GBAR (0015)
Decantation: Decantation of crude sample was carried out. Decantation is the removal of water from the various crude samples.
Polymer used: The Polymer used in this experiment is Xanthan gum. XG is made up of strains of bacteria (Xanthomonas campestris) from the fermentation process of simple sugars. Xanthan gum of 0.01 Molar Concentration was gotten to prepare a buffer solution with 500mls of water.
Buffer solution: A buffer solution of 0.01Molar Concentration of Xanthan gum + 500mls of water were made to break the hydrocarbon molecules of the crude samples without altering the hydrocarbon pH and at a constant temperature of 25 °C.
Viscosity determination: Viscosity was determined using a Fan Viscometer (Rheometer) at; 400mls of Crude oil sample + 200mls of Buffer Solution This was done to further aid the breakdown of hydrocarbon molecules of the crude samples; therefore, a mixture of the 100mls of water + 100mls of the buffer solution was also made due to the increase of viscosity after 7days at a constant temperature of 25 °C.
Results and Discussion
Rheology
Rheology gives a better explanation of the fluid behavior under different conditions. The viscosity of each crude sample was recorded. Also, the viscosity of the buffer solution was recorded and finally, the viscosity of the mixture of each crude sample and the buffer solution was also recorded (400mls of crude oil sample + 200mls of Buffer solution) at a constant temperature of 25 °C. The Shear Stress for the various crude oil samples + Buffer solution was recorded as shown from the 1st Rheological readings. result in the Table 1. NB: The shear stress was gotten from the Power Law Model; this describes the characteristics of the fluid (non-Newtonian) from the Consistency curve plotted by shear stress against the Shear rate [4].


This could also be interpreted by the graph of shear stress vs shear rate which yields a consistency curve that best explains the fluid flow behavior and type (Figure 3A). The consistency curve has the exponential equation as described by the equation,
Shear stress = K x (shear rate)n
Shear rate = 600rpm {highest shear rate (Speed) from the Viscometer}
n = 3.23 Log (θ 600/θ 300)
K = 5.11 (Reading at 300/511n)
K is the fluid consistency unit and n is the power law exponent.
Solution using the power law model equation: The shear stress for the various Samples + Buffer Solution Made up of Polymer (Xanthan gum) and water is shown in the Power Law Calculations Below (Table 2).

1stObservation:

Only Sample A formed a soluble (very viscous) solution after shearing the 400mls of Crude + 200mls Buffer solution (Table 3).

After taken the viscosity readings of the samples, they were left for 7days to see the behavioral patterns/properties of the samples. Therefore, rheology was carried out to note their various viscosities. The table below shows the result after 7days (Figure 3B).
From the experiment carried out, the viscosity of the buffer solution (Xanthan gum +water) decreases with higher shear rates. This is called shear thinning or pseudo-plasticity.
Once the shear forces are removed, the buffer starts to thicken thereby increasing viscosity. NB: The shear stress was gotten from the Power Law Model; this describes the characteristics of the fluid (non Newtonian) [5]. The consistency curve has the exponential equation as described by the equation
Shear stress = K x (shear rate)n
Shear rate = 600 (highest shear rate from the Viscometer)
n = 3.23 Log (θ 600/&3952; 300)
K = 5.11 (θ 300/511n)
The shear stress for the various Samples + Buffer Solution Made up of Polymer (Xanthan gum) and water after 7 Daysis shown in the Power Law Calculation Below (Table 4).

2ndObservation:
After 7 days, the viscosity reduced drastically as a result of the growth of microbes which was very visible in the crude samples and much more visible on the buffer solution (Xanthan Gum + water).
The buffer solution was discovered to be very viscous so an additional 100mls of water was added to it to reduce viscosity which made it to be a solution of 100mls of water + 200mls of buffer solution and the rheology was taken to see the rate of flow and carrying capacity to see if the hydrocarbon can be swept into the reservoir [6].
The hydrocarbon molecules were broken down as a result of the polymer action and growth of microbes after a mixture is formed with the crude oil samples due to a higher shear rate.
The breakdown of the hydrocarbon molecules resulted to an increase in flow (Table 5).

NB: The various crude samples were placed on flow condition using the Darcy's equation in fluid diffusivity for an unsteady state flow process to model a simulated hydrocarbon reservoir.
Darcy equation in petroleum engineering
In Petroleum Engineering, to determine the flow through permeable media the most simple of which is for a one-dimensional, homogeneous rock formation. Recal Darcy Equation in fluid diffusivity equation for an unsteady state process
Q = (-KA )/μ dP/dx
Where,
Q is the flow rate of the formation (in units of volume per unit time)
K is the permeability of the formation (typically in milli- Darcy)
A is the cross-sectional area of the formation
μ is the viscosity of the fluid (typically in units of centipoises)
∂p/∂x represents the pressure change per unit length of the formation.
This equation can also be solved for permeability and is used to measure it, forcing a fluid of known viscosity through a core of a known length and area, the pressure drop across the length of the core. While the flow rate was monitored to see its outcome
The simulated model:
Darcy Equation of fluid diffusivity for an unsteady state process is given by
Q = (-KA )/(μ dP/dx ..............(1)
And the basic fluid flow equation in a porous media is also given by;
d/dx ((KA )/&3956;B dP/dx)+ qsc = VbøCt SwdP/dx ......................(2)
For steady state, dP/dx=0
Therefore,
d/dx ((KA )/&3956;B dP/dx)+ qsc = 0 ...............(3)
Simplifying equation (3) gives;
(d2 P)/(dx2 ) ((KA )/μB) =-qsc ...........(4)
Note that the negative sign indicates production.
Assuming fluid flow rate = Production rate
Then,
qsC = ((KA )/(μBΔx i-1-2Pi+ Pi+1..................5
Let ((KA )/(μBΔx2 )) = λ............ (6)
qsc = λ[Pi-1 - 2Pi + Pi+1]...............7
Considering a First order derivative for Equation (4),
Equation (7) now becomes;
q = λ1[Pi+1 - Pi] .................(8)
Setting [Pi+1 - Pi] as ΔPi = f (i,i+1 ...............(9)
Results to;
q = λ1ΔPi .................(10)
Where,
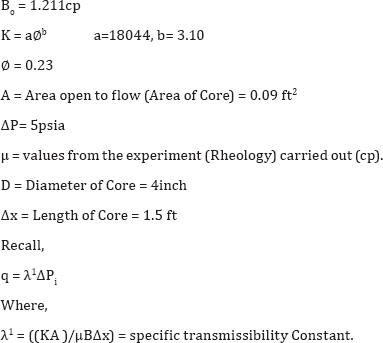
λ1 = ((KA )/μBΔx) = specific transmissibility Constant. (L3 /MT-1)
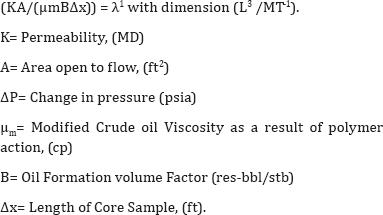
qp= Oil Flow rate as a result of Polymer Flooding, (ft3/sec).
Consider the simulated reservoir system
This is a condition that helps in the determination of the fluid flow behavior Simulated with the following parameters for fluid flow equation at the different fluid viscosities gotten from the experiment carried out
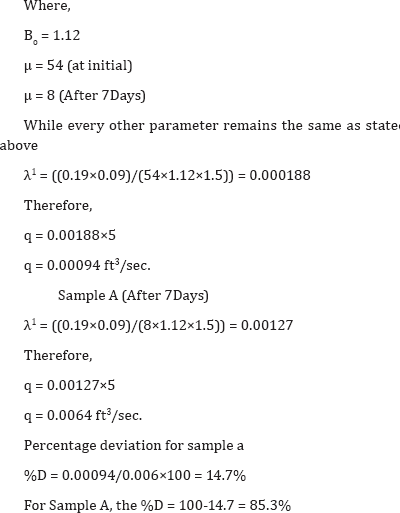
For sample a:
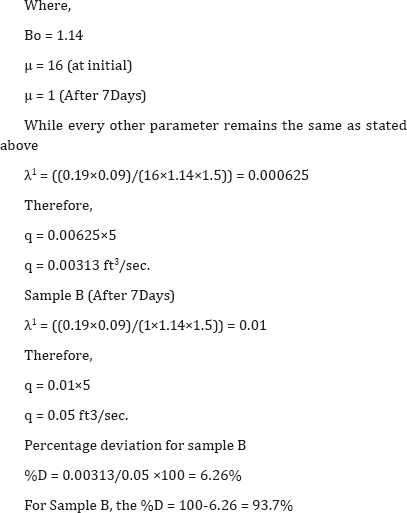
For sample B:
For sample C:
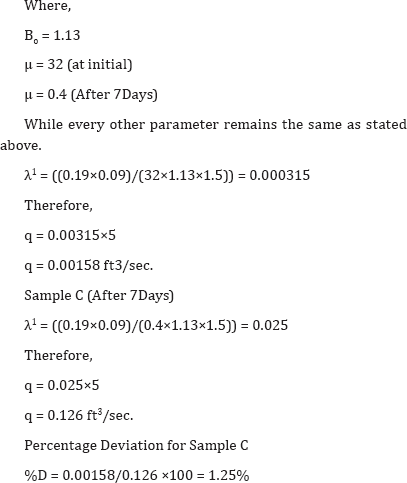
For Sample C, the %D = 100-1.25 = 98.7%
The breakdown of the hydrocarbon molecules by the buffer solution made up of polymer and water shows a significant effect on the fluid by drastically reducing the viscosity after the fluid has been subjected to high shear rate and placed on flow condition on a simulated reservoir system.

A graphical interpretation of the summary in the Figure 4 & 5, better explains the result.

Figure 4 is a Graph indicating the trend of fluid flow; showing how Flow rate increases with decreasing Viscosity (Initially before 7 days), which also shows the effect of pseudo-plasticity; this best describes the type of non-Newtonian flow, where viscosity falls with increasing shear rate. Most molten polymers are pseudo-plastic. The viscosity of Sample A was found to be higher compared to samples B and C despite the share rates. This means, the viscosity of polymer in solution decreases with higher shear rates, which yields a high flow rate [7].
From the result, the higher the viscosity, the lower the flow rate and the lower the viscosity, the higher the flow rate. This experiment proves that Sample C has the best flow rate because it has a viscosity of 0.4cp compared to the other Samples with a better percent deviation of 98.9% which means it has a very high ability to flow at 0.125ft3
/sec after 7days compared to its initial flow rate of 0. 00158.t3/sec.
Conclusion
Xanthan gum is known to be a viscous polymer if subjected to flow once the shear forces are removed, the polymer in solution starts to thicken thereby increasing viscosity, also from the investigation carried out after 7 days, growth of microbes which was very visible in the crude samples and much more visible on the buffer solution had the ability to keep the hydrocarbon pH constant while the heavier molecules in the hydrocarbon are broken down which discovered to drastically increase fluid flow due to shear thinning or pseudo-plasticity.
The viscosity of Sample A was found to be higher compared to samples B and C despite the share rates. This means, the viscosity of polymer in solution decreases with higher shear rates, which yields a high flow rate. Therefore, polymers can be injected into a hydrocarbon reservoir to enhance oil recovery because it is cost effective and environmentally friendly.
References
- Cristina-Eliza B, Berca M (2016) Some properties of Xanthan gum in aqueous solution: Effect of Temperature and pH. Journal of Polymer Research 23: 123.
- Chukwuma NG (2014) Pore characterization of Niger-Delta sandstone formation by numerical methods. International Journal of Emerging Technology and Advanced Engineering 4(5): 488-493.
- Chidiebere AO, Egwu E, Daraha T (2013) Laboratory Investigation of the effect of crude oil spill in Engineering Properties of concrete. IOSR Journal of Mechanical and Civil Engineering 10(2): 11-17.
- Laneuville S, Turgeon SL, Paguin P (2012) Changes in the physical properties of Xanthan gum induced by dynamic high pressure treatment. Carbohydr Polym 92(2): 2327-2336.
- Kang W, Wang D (2001) Emulsification characteristic and Demulsifiers Action for Alkaline/Surfactant/Polymer flooding.
- Katzbauer B (1998) Polymer degradation and stability: properties and applications of xanthan gum. Oil field glossary Slb, Drilling fluid formulas.
- http://www.googlebooks.com


