


Smoothed Jackknife Empirical Likelihood for Weighted Rank Regression with Censored Data
Longlong Huang, Karen Kopciuk and Xuewen Lu*
Department of Mathematics and Statistics, University of Calgary, Canada
Submission: October 31, 2017; Published: April 25, 2018
*Corresponding author: Xuewen Lu, Department of Mathematics and Statistics, University of Calgary, Calgary, AB, T2N 1N4, Canada, Tel: +1-4032206620; E-mail: xlu@ucalgary.caHow to cite this article: Longlong Huang, Karen Kopciuk, Xuewen Lu. Smoothed Jackknife Empirical Likelihood for Weighted Rank Regression with Censored Data. Biostat Biometrics Open Acc J. 2018; 6(2): 555685.DOI:10.19080/BBOAJ.2018.06.555685
Abstract
To make inference for the semiparametric accelerated failure time (AFT) model with right censored data, which may contain outlying response or covariate values, we propose a smoothed jackknife empirical likelihood (JEL) method for the U -statistic obtained from a weighted smoothed rank estimating function. The jackknife empirical likelihood ratio is shown to be a standard chi-squared statistic. The new method improves upon the inference of the normal approximation method and possesses desirable important properties of easy computation and double robustness against influence of both outlying response and covariates. The advantages of the new method are demonstrated by simulation studies and data analyses. We illustrate our method by reanalyzing two data sets: the Stanford Heart Transplant Data and Multiple Myeloma Data.
Keywords: Accelerated failure time model; Jackknife empirical likelihood; Normal approximation; Outlying observations; Rank estimation; Robustness
Abbreviations: AFT: Accelerated Failure Time; JEL: Jackknife Empirical Likelihood; UWJEL: Unweighted JEL; WJEL: Weighted JEL; SSD: Sample Standard Deviation; AESD: Average Estimated Standard Deviation Of Estimators; MSE: Mean Squared Error Of Estimators; CP: Coverage Probability; LC: Length Of Confidence Intervals; JCP: Joint Coverage Probability; MCP: Marginal Coverage Probability; HGB: Haemoglobin; LogBUN: Logarithm Of Blood Urea Nitrogen; NSERC: National Science and Engineering Council
Introduction
A primary interest of survival analysis is often to understand the relationship between survival times and covariates measured on study participants, such as physical and biological measurements and medical conditions. Typically, survival data are not fully observed on all subjects, but rather some response values are censored. For i =1,...,n,let T representthe survival time for the ithsubject, Xibe the associated p-dimensional vector of covariates, Cidenote the censoring time and δi denote the event indicator, i.e., δi =I(T i≤Ci), which takes the value 1 if the event time is observed, or 0 if the event time is censored. Conditional on the covariates for the ithsubject, ciis assumed to be independent of the failure times Ti We define y ias the minimum of the survival time and the censoring time, i.e., yi= mm (Ti,Ci). Then, the observed data are in the form (yi,δi,xi),i= 1,...,n,which are assumed to be an independent and identically distributed (i.i.d.) sample from (y,δ X), here y =min (T, c) and δ = I (T ≤ C).
The Cox proportional hazards (PH) model is the most prominent regression model used in survival analysis. However, when the proportional hazards assumption is not satisfied, the Cox PH model can produce incorrect regression parameter estimates. The accelerated failure time (AFT) model provides a useful alternative to the Cox PH model, where its covariate effects on the log transformed survival time T can be directly interpreted in terms of the regression coefficients. Because of this physical interpretability, the AFT model is more appealing than the PH model [1]. Following the definition in Kalbfleisch &Prentice [1] and Heller [2], the AFT model is defined as

Where the εi'sare i.i.d random errors with an unknown distribution function and are independent of the covariates xi's,β0 is the unknown true regression p-dimensional parameter to be estimated, and αTdenotes the transpose ofa vector or a matrix a. In data analysis, the log survival times from the regression residual, εβ= log(T)-βTx,can be very large for small failure times, which is an indication that estimation and inference are sensitive to small failure times. Rank regression has been shown to be an effective method to regain robustness with respect to the outlying log survival times. For example, Fygenson & Ritov [3] proposed a monotonic rank estimating function
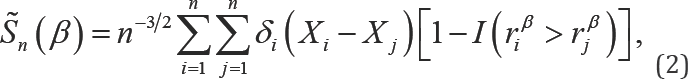
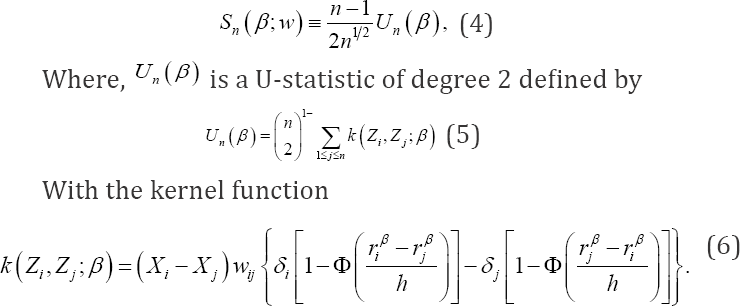
Where, rβi = log(yi)-βT'xi. This estimating function is not continuous in β because of the indicator function I(riβ > rjβ). This discontinuity creates difficulties in the derivation of the asymptotic distribution and computation of the estimator of β To overcome these difficulties, Heller [2] developed a smoothed rank estimating function, which is monotonic and continuous with respect to the parameter vector. Moreover, to reduce the influence of outlying covariate values, he introduced a weight function in the smoothed rank estimating function. Heller's weighted smoothed rank estimating function for estimating β0 is given by
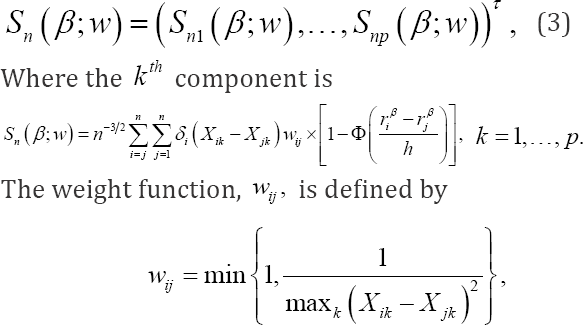
Which is symmetric and is chosen to reduce the influence of outlying covariate values on the estimator of β0 and its asymptotic variance. The function, Φ(.) is a local cumulative distribution function and is usually taken to be the standard normal distribution. It is a smooth approximation to the indicator function (riβ > rjβ) in (2) and ensures that sn. (β; w) is differentiable in β and has bounded influence. The bandwidth, h, is used for smoothing purposes and satisfies conditions: n →∞, nh →∞, and nh4→ 0. In practice, as suggested by Heller [2], h can be set equal to  where
where  is the sample standard deviation of the uncensored residuals
  is the zero solution of the estimating equation given in (3), and designated to be the estimator of the regression parameter βo, the exponent, -0.26, provides the quickest rate of convergence while satisfying the above bandwidth conditions.
Which is symmetric and is chosen to reduce the influence of outlying covariHeller [2] demonstrated that the weighted smoothed rank estimating function is not only robust to outlying survival times, but also to outlying covariate values, that is, it possesses the double robustness property. The computation of  becomes much easier than that of an estimator derived from a nonsmoothed estimating equation, and it may be implemented through the standard Newton-Raphson algorithm. Heller [2] obtained the asymptotic normal distribution of and established an inference procedure based on the normal approximation (NA) method. Many other methods have been suggested for censored regression. For example, Portnoy [4] proposed a censored regression quantile method, which is used to analyze conditional survival function without requiring specific distributional assumptions on the errors. Jin et al. [5] provided simple and reliable methods for implementing the Gehan rank estimator in the AFT model.
Which is symmetric and is chosen to reduce the influence of outlying covariIn this paper, we will develop an empirical likelihood based inference method and investigate its theoretical and numerical properties. We aim at improving the finite sample performance of the NA method. In the last two decades or so, the empirical likelihood (EL) method has become an attractive inference method for a number of statistical problems. In contrast to the NA method, the EL method has many nice features, for example, it combines the reliability of nonparametric methods with the effectiveness of the likelihood approach, and does not require variance calculations. Its application can be found in many publications. Owen [6,7] introduced EL confidence intervals and regions for parameters; Qin & Lawless [8] established Wilks' theorem for EL in an estimating equation seting; Owen [9] investigated EL for linear regression; and Qin & Zhou [10] suggested EL inference for the area under the ROC curve.
For the AFT model, Zhou [11] considered EL based on the censored empirical likelihood and Zhao [12] studied EL based on Fygenson & Ritov [3] estimating equation. Recently, Jing et al. [13] proposed the jackknife empirical likelihood (JEL) method, which combines the jackknife and the empirical likelihood for U-statistics. The most important property of the JEL method is its simplicity, which overcomes computational difficulty in an optimization problem with many nonlinear equations when sample size gets large. Based on the Gehan estimator studied by Jin et al. [5], Zhou [11] used EL method to obtain confidence regions. Our work is motivated by two survival data sets with outlying covariate values which have not been taken into account in the published analyses by researchers using both NA and EL methods.
Another strong motivation comes from both the double robustness property of the weighted smoothed rank estimator and the appealing finite sample properties of the JEL. In this paper, we will develop a new smoothed JEL method in the regression setting for the AFT model, where the parameters of interest may be multi-dimensional and are contained in some smoothed estimating functions, which involve a smoothing parameter and are multi-dimensional U statistics. Jing et al. [13] considered JEL for making inference about a one-dimensional parameter, whose estimator is directly defined by a U-statistic. Hence, their method cannot be immediately applied to our case. We will extend their method to smoothed estimating functions containing a multi-dimensional parameter vector and provide a rigorous justification for the proposed method. Via simulation studies and two real data examples, we will show that the proposed JEL method not only inherits the double robustness property of the NA method, but also contains some superior finite sample properties to the NA method. Hence, this new method provides a very useful and reliable tool for survival data analysis, which is easy for practitioners to adopt in their research work. The paper is organized as follows. In Section 2, we apply the JEL to the U-statistic derived from the weighted smoothed rank estimating function and show that the JEL ratio follows a standard chi-squared distribution. In Section 3, we conduct simulation studies to compare the performance of the JEL, NA and other competitors. In Section 4, we reanalyze two real data sets using our method: the Stanford Heart Transplant Data and the Multiple Myeloma Data, and compare the new method to other methods used in the literature. Section 5 includes our conclusion and discussion. Technical proofs are given in the Appendix.
Methodology and Main Result
NA method
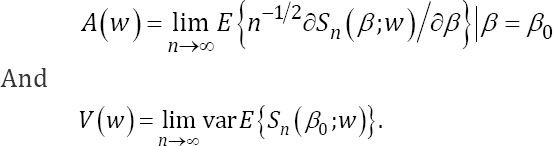
Before we introduce our new inference method for the AFT model defined in (1), we state the result of the NA method given in Heller [2] Theorem 2 in the following paragraph. For the AFT model, under conditions C1-C 4 given in Appendix, the weighted smoothed rank estimating function vector sn.(βw) given in (3) is a monotone field, is differentiable in β, and has bounded influence. The regression estimator has an asymptotically normal distribution, i.e., 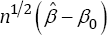 converges in distribution to
 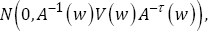 Where
Where
To provide the NA based inference for β0, one needs to estimate the variance-covariance Matrix 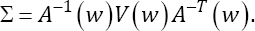 The estimator is given by
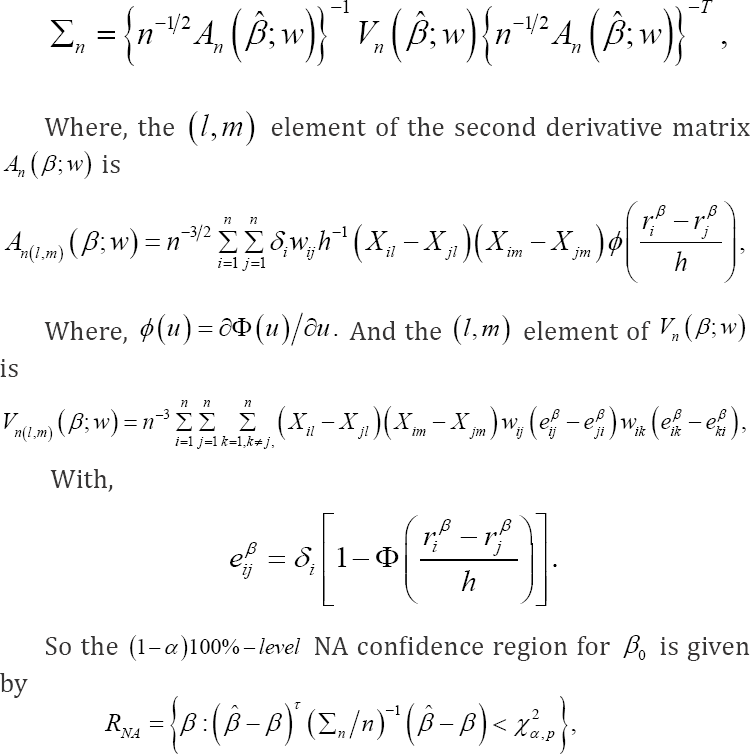
Where x2α,p is the αth upper quantile of the chi-squared distribution with p degrees of freedom. When p =1, the confidence region RNA becomes the confidence interval given by

Where, Zα/2 is the (α/2)th upper quantile of the standard normal distribution. Taking wij≡1, we obtain the unweighted smoothed rank estimating function, sn(β), as follows:
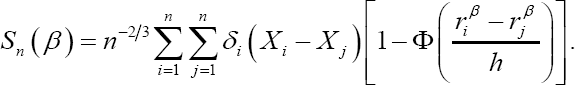
The estimator of β0 based on this estimating function is its zero solution and Theorem 1 in Heller [2] provides the asymptotic distribution of this estimator. By imposing weights in the smoothed rank estimating function, Heller [2] Theorem 2 stated above indicates that its bounded influence provides stability to the regression estimator in the presence of outlying survival times and covariate values, hence, the estimator posses the double robustness property.
Smoothed JEL method
Let We rewrite the weighted smoothed rank estimating function,Sn(β;w)given in (3) as a U-statistic with a symmetric kernel function in the following,
The kernel has expectation of order 0(h2 when evaluated at  The U-statistic Un (β) is considered as a smoothed version of its analogue in
  given by (2), which satisfies
  We will apply JEL to this U-statistic to get a smoothed JEL. To do that, we define jackknife pseudo-values as

Where,  is the statistic un-1 (β) computed on the sample of n -1 variables formed from the original data set by deleting the ith data value. Using these jackknife pseudo-values
  evaluated at β, we define the following jackknife empirical likelihood function,
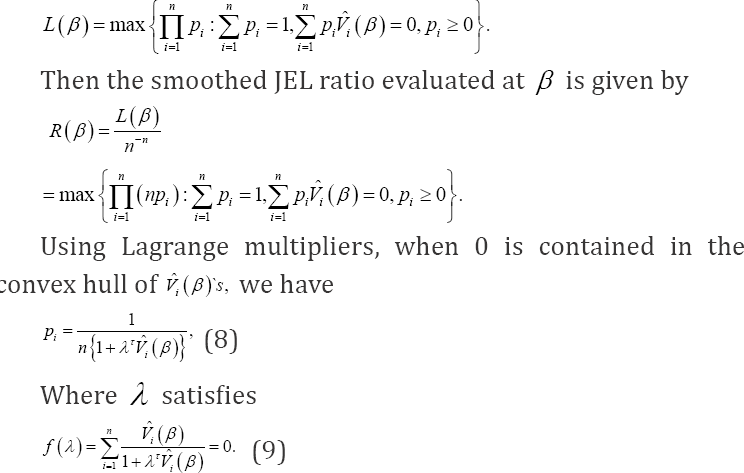
The smoothed jackknife empirical log-likelihood ratio becomes
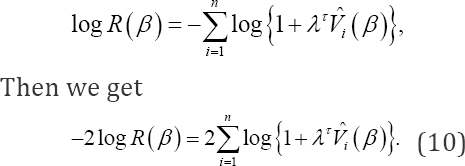
Jing et al. [13] proposed JEL for a single parameter using one-dimensional U-statistics and obtained several asymptotic results. We can easily extend their results to p-dimensional U-statistics and then to the smoothed JEL under the current setup. We state our main result in the following theorem, and relegate the proofs to the Appendix.
Thehorem 1: Define p x1 vector 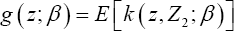 and px p variance-covariance matrix
 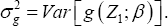 Under the conditions for the NA method stated in Heller (2007)'s Theorem 2, we have <
 (finite in element wise for a vector) and
  (positive-definite for a matrix). Then, when β = β0, we obtain

As n → ∞, where  denotes convergence in distribution. Based on this theorem, a (1—α;)100%—level JEL confidence region for β0 is given by
To construct confidence intervals or regions for a single element or a q-dimensional (1 < q < p) subvector β1 of the regression parameter vector  we propose profile JEL for &3946;1 defined as
Where,  denotes the (p-q)dimensional Euclidean space. The following theorem is similar to Theorem 1 for a full parameter vector. The proof of this theorem can be obtained by following that of Theorem 2.2 in Zhang & Zhao [14], we omit it here.
Theorem 2: Under the conditions for the NA method stated in Theorem 1, denote β01 as the true value of β1, then the limiting distribution of  is a chi-squared distribution with q degrees of freedom. That is
The idea of smoothed empirical likelihood is not new in the literature, for example, Whang [15] considered a smoothed empirical likelihood method to make inference for quantile regression models, where the estimating function is actually a U-statistics of degree one only and JEL is not needed. Here, our work further extends smoothed EL to smoothed JEL for the popular AFT model with possible outlying response or covariate values in survival analysis, and provides an exemplar of inference procedure for other types of rank regression models, where similar theoretical results can be established accordingly.
Simulation studies
In this section, two simulation studies are conducted to compare the performance of the NA method and other competitive methods to that of the smoothed JEL method under different contaminating conditions on survival times and covariate values. To evaluate sensitivity of the NA and JEL methods to the weights used in the smoothed rank estimating functions, results are also compared between the weighted and unweighted smoothed rank estimating functions under different censoring rates and sample sizes. In the first simulation study, we fit a model with a one-dimensional continuous covariate, and then compare the bias of estimators, sample standard deviation of estimators, average estimated standard deviation of estimators, mean squared error of estimators, the coverage probability and average length of the confidence intervals. In the second simulation study, a model with a two-dimensional covariate is fitted, and the performance of different methods is compared in terms of joint coverage probabilities and marginal coverage probabilities.
Simulation Study 1: AFT model with a one-dimensional co-variate
In the following AFT model with a one-dimensional covariate,
where the true regression parameter β0 =2 The censoring time C was generated from a uniform distribution U(0,c), here determines the censoring rate (cr). We chose different values of c to produce cr = 25%, 5o%, 75%, respectively. Sample size was taken to be n = 30 and n = 100, respectively. Various combinations of error distribution, censoring rate and sample size provide a comprehensive comparison between the NA and JEL methods. In order to compare the proposed method with its competitors in the literature, we also consider the quantile regression of Portnoy [4], the Gehan rank regression of Jin et al. [5] and the empirical likelihood method of Zhou [10] in simulation studies. For ease of presentation, we construct the error term ε as follows. Assume e be an arbitrary continuous random variable with cumulative distribution function Fe (t), let μe =E(e) and  For any 0 τ< 1, the τth quantile of e is given by F—1 (τ). For any σ> 0, we define error term as
 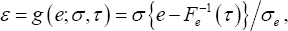 which represents a (σ,τ) dependent transformation of e, then we have
  and Var(ε)=σ2, the Tth quantile of ε equals 0.
In the above AFT model,  denote the kth quantile ofε by tk, then we have the kth conditional quantile of Y =log(T) given X equals
  i.e., the parameter β0of interest is the slope parameter in both the quantile regression and the log-linear AFT model, we can compare the performance of different methods by aiming at the same target parameter β We choose four different error distributions corresponding to four types of skewness in simulation. Through the aforementioned process, they are generated from
  and standard extreme value distribution (EV) with probability density function
  and variance π2/6, respectively, where N(0,1) is standard normal distribution and symmetric, X2 (df) is chi-squared distribution with df degrees of freedom and skewed to the right, smaller df results in larger skewness and vice versa, and EV is skewed to the left and can be generated from exponential distribution by e = log(u), u follows exponential distribution with rate equal to In this simulation setup, two different simulation scenarios were considered for four error distributions. In the first scenario, the univariate covariate X was generated from the standard normal distribution N(0,1). For
  respectively, the error term ε was generated from
  here τ = 0.5 represents median regression.
In the second scenario, a data set with a contaminated covariate and a contaminated error distribution was generated to test robustness of the NA and JEL methods. Specifically, 95% of the values of the covariate X were generated from the standard normal distribution n (0,1) and 95% of the error term ε values were generated from  The other 5% of the covariate X values were generated from the normal distribution N°-5,1) and 5% of the error term ε values were generated from
  which contains a larger σ than in
  The details for the setup of this simulation study are displayed in Table 1.

We conducted simulation studies to compare the performance of the quantile regression method of Portnoy [4] (QR), the Gehan rank estimation method of Jin et al. [5] (JinNA), Heller's unweighted estimation method (UWNA), Heller’s weighted estimation method (WNA), the empirical likelihood method of Zhou [10] (ZhouEL), and the proposed unweighted JEL (UWJEL) and weighted JEL (WJEL) methods, in terms of bias (Bias) of estimators for β0 = 2, sample standard deviation of estimators (SSD), average estimated standard deviation of estimators (AESD), mean squared error of estimators (MSE), coverage probability (CP) of 95% confidence intervals, average length of confidence intervals (LC). QR, JinNA and ZhouEL were implemented using R functions crq, lss and RankRegTest in the R packages quantreg, lss and emplik, respectively.
There were B = 1000 replications in each simulation setting. We did 50 th quantile regression (i.e., median regression with τ = 05) under low and medium censoring rates (cr = 25; 50%), results are denoted by QR,.0.5, which guaranties that the estimates of coefficients could be obtained. When censoring rate is high (cr = 75%), we did 25th quantile regression denoted by QR0.25 for the same reason. Weighted and unweighted smoothed rank regression functions were investigated for both NA and JEL methods with both uncontaminated and contaminated data. Since Portnoy's, Jin’s and Zhou's methods are available for unweighted cases only, and extending their methods to weighted cases is not trivial and beyond of the scope of the current research, we did not consider them in our simulation studies. The results are reported in Tables 2-5. We observe that QR method has relatively larger MSE, lower coverage probabilities and wider confidence intervals. Jin’s Gehan rank estimation method is similar to Heller's UWNA. Zhou’s EL approach is suited to the data with low censoring rate and large sample size. The coverage probabilities of JEL are closest to the nominal level 95% compared to those of NA and other competitors in most cases. This is particularly true for small sample sizes (e.g. n = 30) and high censoring rates (e.g. cr = 75%). It implies that JEL generally has better coverage probability than NA and other methods. On the other hand, the average length of JEL is slightly longer than that of NA and other methods. Also, when the sample size increases or the censoring rate decreases, the average length becomes shorter. In the cases of uncontaminated covariates, using weights or contaminated covariates, the weighted methods perform much better than the unweighted methods (to abuse terminologies in some way, we use weighted methods to refer to the JEL and NA methods based on the weighted smoothed estimating function, do not necessarily reduce the bias of the unweighted methods, but they provide more accurate approximation to the sampling distributions of the estimators, then result in better coverage probability.


Simulation study 2: aft model with a two-dimensional co-variate
In this simulation study, we simulate the model with a two dimensional covariate as follows:

Where β=(β01,β02)τ, =( 2,-1)τ Similar to the one-dimensional simulation, this simulation setup also has two scenarios. We considered three different error distributions, i.e., e ~ N (0,1), EV and x2 (df = 6), respectively. In the first scenario, X1i and x2i, were generated from the standard normal distribution N (0,1), X1i; and X2i are independent, the error term ε was generated from  In the second scenario, 95% of the covariates X1i, and X2i were generated from the standard normal distribution N(0,1), 95% of the error term ε values were generated from the other 5% of the X1i and X2i, were generated from the normal distribution N(-5,1), and 5% of the error term
  values were generated from All other information was the same as that in the one-dimensional case.
'Besides Bias, SSD and AESD, we also report the joint coverage probability (JCP) of 95% confidence regions for β0 from JinNA, ZhouEL, NA and JEL methods respectively and marginal coverage probability (MCP) of 95% confidence intervals for each parameter component from all the methods. Again the results in Tables 6-11 show that in most cases, JEL has better performance than other methods. Especially when the censoring rate gets large and the sample size is small, QR was not stable and produced extraneous estimates, the JCP and MCP based on JEL is much closer to the nominal level than all the other methods. This again indicates that JEL has better inference precision than NA and other methods. When the covariates are contaminated, the weighted NA and JEL methods work better than the corresponding unweighted methods. The weighted methods perform better even when there is no contamination in the covariates. Hence, the weighted JEL method is the best choice in all the circumstances, and it is recommended for use in practice.


Application to real data analysis
In this section, two real data sets are used to illustrate our method and to compare with other methods in the literature. The data sets include the Stanford Heart Transplant Data and the Multiple Myeloma Data. Previous authors have analyzed these data sets in their work, for example, Jin et al. (2003) and Zhou (2005), but they didn't take outlying covariate values into consideration. Following their analyses, we consider a single continuous covariate in the first data set and two continuous covariates in the second data set. We first demonstrate that outlying covariate values exist in these data sets, and then we apply the proposed weighted JEL method for analysis.
Stanford heart transplant data
The Stanford Heart Transplant Data can be found in Miller & Halpern [16], and is obtained by using attach(stanford2) inside the R survival package. In short, the Stanford heart transplant program began in October 1967 and a total of 184 patients received heart transplants. The information contained in the data set include: survival time in days; an indicator of whether the patient was dead or alive by February 1980; the age of the patient in years at the time of transplant; and the T5 mismatch score, which makes a distinction between deaths primarily due to rejection of the donor heart by the recipient's immune system and non-rejection related deaths. For 27 of the 184 transplant patients, the T5 mismatch scores were missing because the tissue typing was never completed. Following Miller & Halpern [16] suggestion, the five patients with survival times less than 10 days were deleted in order to compare our new methods with existing methods. In the end, there were 152 cases with a complete data record, which we will use to fit the following

Where, T is the survival time and Xi is the age of the ith patient at their heart transplant. In this data set, the censoring rate is cr = 36% with 55 people still alive at the end of the observation period and 97 deceased individuals. At first, we use box plots to check the outliers of the observed response Yi and covariate Xi. Figure 1 clearly shows that there are some outliers (small values) of the ages of the patients, therefore, the weighted JEL is desirable. The results from the fitted model based on weighted approaches are: = -0.0537 with se ( )=0.0171. The 95% WJEL and WNA confidence intervals for β are (-0.0890,-0.0210) with length=0.068 and (-0.0872,-0.0202) with length=0.067, respectively. They are very close except for a lightly longer length by JEL. Both confidence intervals indicate a significant negative association between age and survival time in this patient population.

When we ignore the outliers and use the unweighted methods, we obtain = -0.0255 with se() = 0.0171. The 95% UWJEL confidence interval for β (-0.0436,-0.0035) and 95% UWNA confidence interval for β is (-0.0465,-0.0044). These results are quite different from those based on the weighted methods, however, they are very similar to those of Zhou [10] which show that = -0.0253 with se () = 0.0107. obtained from the resampling method, the 95% confidence interval for β based on the censored empirical likelihood ratio is (-0.0446,-0.0030) and the 95% Wald confidence interval is (-0.0462,-0.0044). This is not surprising, since Zhou's method does not take the outliers into consideration and is an unweighted method.
Multiple myeloma data
The Multiple Myeloma Data were reported by Krall et al. [17] , and can be obtained from SAS [18]. The data set contains information for survival times and nine covariates: survival time, censoring status, logarithm of blood urea nitrogen (LogBUN), haemoglobin (HGB), Platelet, Age, LogWBC, Frac, LogPBM, Protein, SCalc. Out of total of 65 observations, 17 were censored, and the censoring rate is cr=26%. Following Jin et al. [5], we fit an AFT model with these two covariates: Log(BUN) and HGB. To improve numerical efficiencies, we also standardize the original covariates to have zero mean and unit variance. The fitted model is
Where Xli is the standardized score of Log(BUN), and X2i is the standardized score of HGB.
From Figure 2 we notice that the standardized scores of Log(BUN) have outliers (large values). Using the weighted methods, we obtain weighted NA estimates of the regression coefficients,  with estimated standard errors (0.1626, 0.1753), respectively. The chi-square test statistics with 2 degrees of freedom for testing (β1,β2) = (0.0) based on the WJEL method and the WNA method are 11.34 and 11.21, and the corresponding p-values are 0.003 and 0.004, respectively, both indicating a jointly significant effect of Log(BUN) and HGB on survival time. The estimates obtained from the unweighted methods are
  with estimated standard errors (0.1399, 0.1732). The chi-square test statistics with 2 degrees of freedom for testing (β1,β2) = (0.0) based on the UWJEL method and the UWNA method are 16.909 and 16.666, and the corresponding p-values are 0.00021 and 0.00024, respectively. The estimated regression coefficients are similar to Jin et al. (2003)'s results, which did not consider outliers and weights: their estimates were (-0.532, 0.292) with estimated standard errors (0.146, 0.169). These results once again substantiate our claim that when covariates have outliers (e.g. the standardized score of LogBUN), the rank estimates of regression coefficients under the weighted and unweighted methods may be quite different [19-21].

Conclusion and Discussion
In this paper, we have developed the smoothed JEL method, a new inference method for the regression parameters in the AFT model with right censored data containing outlying response or covariate values. Based on the weighted smoothed rank estimation function proposed by Heller [2], jackknife and empirical likelihood are integrated to yield the new method. The proposed smoothed JEL method preserves not only important features of empirical likelihood, but also the double robustness of the weighted smoothed rank estimation. Another advantage of the new method is that it can be easily implemented in a standard software environment and used by practitioners, for example, the R package such as emplik already exists to maximize the empirical likelihood functions and to obtain the values of the test statistics. Simulation studies indicate that the smoothed JEL method outperforms the NA and other competitors in the sense of improving accuracy of inferences for regression parameters. This is especially evident when sample size is small or censoring rate is high. Two real data sets with outlying covariate values are reanalyzed using the new method and the results show superiority of the new method over those in the literature. Therefore, in practice, when the AFT model is used for survival data analysis, especially when there are outlying observations in either responses or covariates, the proposed method deserves first consideration. Our method can also be extended to other types of rank regression models, we leave this for future research.
Acknowledgement
The authors acknowledge with gratitude the support for this research via Discovery Grants from National Science and Engineering Council (NSERC) of Canada. They are grateful to Dr. Heller for giving them his Fortran program, which helped them to develop R programs for numerical studies.
References
- Kalb JD, Prentice RL (2002) The Statistical Analysis of Failure Time Data. John Wiley & Sons, Hoboken, New Jersey, USA.
- Heller G (2007) Smoothed rank regression with censored data. Journal of the American Statistical Association 102(478): 552-559.
- Fygenson M, Ritov Y (1994) Monotone estimating equations for censored data. The Annals of Statistics 22(2): 732-746.
- Portnoy S (2003) Censored regression quantiles. Journal of the American Statistical Association 98(464): 1001-1012
- Jin Z, Lin DY, Wei LJ, Ying Z (2003) Rank-based inference for the accelerated failure time model. Biometrika 90(2): 341-353.
- Owen AB (1990) Empirical likelihood ratio confidence regions. The Annals of Statistics 18(1): 90-120.
- Owen AB (1988) Empirical likelihood ratio confidence intervals for a single functional. Biometrika 75(2): 237-249.
- Qin J, Lawless J (1994) Empirical likelihood and general estimating equations. The Annals of Statistics 22(1): 300-325.
- Owen AB (1991) Empirical likelihood for linear models. The Annals of Statistics 19(4): 1725-1747.
- Qin G, Zhou XH (2006) Empirical likelihood inference for the area under the roc curve. Biometrics 62(2): 613-622.
- Zhou M (2005) Empirical likelihood analysis of the rank estimator for the censored accelerated failure time model. Biometrika 92(2): 492498.
- Zhao Y (2011) Empirical likelihood inference for the accelerated failure time model. Statis-tics & Probability Letters 81: 603-610.
- Jing BY, Yuan J, Zhou W (2009) Jackknife empirical likelihood. Journal of the American Statistical Association 104(487): 1224-1232.
- Zhang Z, Zhao Y (2013) Empirical likelihood for linear transformation models with interval-censored failure time data. Journal of Multivariate Analysis 116: 398-409.
- Whang YJ (2006) Smoothed empirical likelihood methods for quantile regression models. Econometric Theory 22(2): 173-205.
- Miller R, Halpern J (1982) Regression with censored data. Biometrika 69(3): 521-531.
- Krall JM, Utho VA, Harley JB (1975) A step-up procedure for selecting variables associated with survival. Biometrics 31(1): 49-57.
- SAS II (1999) SAS/STAT User's Guide, Version 8. SAS Institute Inc., Cary, NC, USA.
- Hoe ding W (1948) A class of statistics with asymptotically normal distribution. The Annals of Mathematical Statistics 19(3): 293-325.
- Lee AJ (1990) U-statistics: Theory and Practice. Marcel Dekker, New York, USA.
- Owen AB (2001) Empirical likelihood. Chapman & Hall/CRC, London, UK.


